GC Modeling Tool (Restek)
Jaap de ZeeuwAbstract Restek provides a web program, called “ProEZGC”, that allows anyone to simulate separations and change all the GC parameters on-line and experience how separations are impacted. This article describes this program, a free tool that anyone can use, based on calculating retention times based on real measurements.
LevelBasic
It’s a known problem: students get into chemistry education and learn physical chemistry including physical separation methods. They learn filtration, gravimetry, distillation and also “chromatography”. The chromatography part however is very generic and at best a few injections are done and the results are explained. When it comes to optimization methods, there is very little flexibility as students are not really allowed to work practically with a GC. This is a major gap preventing students to learn how all parameters used in GC impact the separation.
Use as educational tool
In today’s educational systems there is not enough time to give students sufficient “hands-on” experience with a gas chromatograph. This while it is very educational understanding the impact of parameters like oven temperature, flow, phase chemistry and column dimensions on separation and analysis time. Usually in the university labs there are only a few gas chromatographs and columns available. If one has to study the impact of one parameter, it takes a lot of time to generate the data, meaning the instrument is occupied.What is it?
The recently introduced ProEZGC modeling software for GC is a selectivity tool that relies on a pre-loaded library of thermodynamic retention indices. This makes it possible to predict retention times and optimize chromatographic methods without the need to analyze your compound sets under many different conditions. The program allows the user to select from a series of stationary phases and simultaneously change temperature, Carrier gas type, carrier gas flow, column length, column internal diameter and film thickness. Users can enter each compound by name or CASS-nr. or cut/paste large lists of compounds into the program.You can find the program at the Restek site, click to go there directly.
What can it do for you?
The program outputs are: compound retention time, resolution and peak width along with the column conditions and dimensions. A model chromatogram is provided to illustrate retention, peak width and resolution. Users have the option to view compound mass spectral data with the added benefit of overlaying mass spectra for co-eluting analytes. The expanded capabilities allow the user to choose column dimension and conditions. Specific searches can be saved and accessed at a later date. Besides developing optimal new applications, it is also possible to optimize many existing applications WITHOUT having a GC available, saving a lot of time and costs. For this 100% free service, you register once and set a password.The web tool offers a huge value for learning the impact of parameters on separations and it is fast and interactive. When a parameter is changes, immediate the result on the separation is displayed. Think of changing the oven temperature, the column flows, the column dimensions. Even the type of carrier gas can be changed and one can immediately see the impact on the separation. In many labs they use helium as it’s the “fastest” carrier gas. Now anybody can see how the separation is using Nitrogen as carrier gas. Yes, the peaks will be a bit broader and a bit lower, but for 90% of applications this is not an issue. Nitrogen is cheap and can even be produced in the laboratory, a very interesting alternative.’
Simulation of separations
Being a chromatographist, initially the word “simulation” creates a negative vibe for me, but once I learned how this can benefit todays user, its a very cool tool.In GC we are very lucky as we have only a limited nr of parameters to influence separations. There is “ Selectivity”, which depends on interactions of analytes with stationary phase. The other factor is temperature. As pi-pi and van de Waals (Londen) interactions are depending on temperature separations will also change when the temperature changes.
Then we have “retention”. This depends on film thickness, column dimension, temperature and carrier gas velocity (and this velocity depends again on column dimension, type of carrier gas, pressure and temperature). There is a mathematical relation between these parameters, which allows modeling.
Once the relation of retention vs temperature for a component is known on a specific stationary phase, one can predict the elution time/temperature and create a model. To make a prediction, one must measure accurate the retention of the component under exact defined temperature programmed conditions.
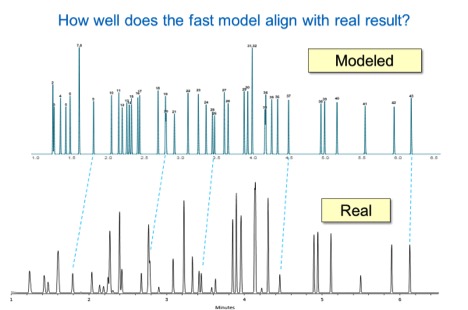
A chromatogram of a list of analytes can be generated, which can be optimized and when conditions are copied in real life, the same result can be expected. The power behind the ProEZGC is a huge database of near 8000 components and the information that we know how components behave on different stationary phases. As the main factors for retention for a certain component are temperature and interaction, the retention of components is measured on stationary phases using several defined temperature programs. This way it is possible to model elution times very accurately.

The practical value
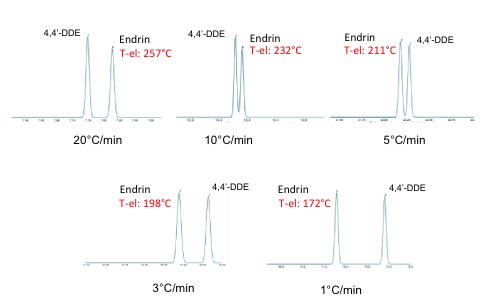
The program allows the student to quickly see the impact of any change in temperature, column dimensions, flow, and outlet pressure on the separation of their analytes. It’s an incredible resource that immediate show the impact of any change in parameter, on the final result.Students are able to see how separations are impacted, not just on time of analysis, but also on peak sequence and separation. When temperature programs or column flows change, also the elution temperatures of the eluting components change. As a result, the separations (elution times/orders) can change. Some separations improve, some separations get worse or can even disappear. Many people in daily life do not even realize that. For example, the separation between two pesticides endrin and 4,4’-DDE.

The above figure shows how this separation changes when different temperature programming is used. Elution temperatures for endrin change from 257°C to 174°C and make this peak elute in a complete different position.
The program adds a unique experience for students to explore the powers of chromatography and especially one can do many experiments themselves.
One can simply ask to “optimize” a certain separation, while providing a nr. of practical limitations. For example:
“I have a MS system and I need to optimize throughput in order to reduce cost per analysis..” The limitation of the MS system often is the vacuum pump capacity, being approx. 2 mL/min. So that would make it very interesting to optimize the analysis using this (higher) flow rate. Another exercise could be to use a smaller diameter or a shorter column to reduce runtime.. Maybe use Hydrogen or Nitrogen as the carrier gas.. or a combination of a different carrier gas and shorter columns. Or push the column flow to extreme values. One can even compare separations on different stationary phases and select the most suitable phase before doing the optimization of the GC parameters. Everything can be modeled and visualized. Models are all interactive: they can be saved and revisited.
Limitation
One can only model the components that are in the database and for choosing the optimal phase one must always consider that there may be more selective phases available. Also, the program displays the components as Gaussian peaks. In real life one can have tailing caused by injector, transfer lines, ionization source or column. Or peaks may show overload due to sample composition or lack of loadability of the column. The program assumes ideal injection. Early eluting peaks are usually broader due to a broader injection band.For learning chromatography, it’s a great tool and it allows students to experience the power of gas chromatography at their fingertips. To make it work for you, one only has to register and choose a password. This is a link to 3 tutorial video’s that will help you.


