Abstract Chromatographic properties of RPLC phases can only be specified in conjunction with a particular mobile phase system and are a function of the nature and concentration of the organic modifier(s), the pH of the eluent, the nature and concentration of buffer salts or additives in the eluent and the temperature.
LevelAdvanced
In RPLC the main separation mechanism is based on:
- "Primary hydrophobic retention mechanism": Interactions between the hydrophobic parts of the analytes and those of the stationary phase.
- "Secondary retention mechanisms": polar and ionic interactions.
The surfaces of RPLC phases contain a number of sites with chromatographic activity, e.g. ligands and residual silanols or other ionic and polar groups from the underlying substrate![]() . A number of models including hydrophobic theory, the solubility parameter concept, and the partitioning and adsorption models have been
. A number of models including hydrophobic theory, the solubility parameter concept, and the partitioning and adsorption models have been ![]() developed in order to explain and optimise retention and selectivity in RPLC.
developed in order to explain and optimise retention and selectivity in RPLC.
RPLC eluents usually consist of water or an aqueous buffer to which miscible organic modifier(s) are added. The nature and concentration of these modifiers can be used to adjust the polarities of both the mobile and the stationary phases, and hence to optimize retention and selectivity. The same is true for the pH and ionic strength of the eluent. In addition, the ![]() eluent pH also determines the dissociation rate and polarity of analytes, especially weakly ionic ones.
eluent pH also determines the dissociation rate and polarity of analytes, especially weakly ionic ones.
Retention and selectivity in HPLC are governed by the thermodynamic parameters entropy (S), enthalpy (H), and the temperature (T). The relationship between the logarithm of the retention factor, k, and S, H, and T is described by the van ‘t Hoff equation:
![]()
Where:
k= retention factor
T = absolute temperature
H = enthalpy
S = entropy
R=gas constant
β (Beta) = column phase ratio
Van 't Hoff plots can be obtained by measuring the ln k values of an analyte on a specific column as a function of temperature at constant eluent conditions. The plot is made by regressing lnk versus 1/T. Such plots are linear if ΔH and ΔS are independent of the temperature. Nonlinear van’t Hoff plots indicate a change in retention mechanism. From the slope of such plots, the standard enthalpy (Δ H) of transfer can be calculated, indicating the extent of energy exchange in a chromatographic system. From the intercept of a van’t Hoff plot and the column phase ratio, the standard entropy (Δ S) can be calculated, and is a measure of the entropy change in transferring the analyte from the mobile to the stationary phase.
For non polar to moderately polar analytes, RPLC retention and selectivity are determined by a couple of relatively simple rules. The illustration below shows that:
- Retention increases linearly upon the increase of the ligand chain length up to a
 critical chain length in alkyl modified phases.
 - The slope of this line is dependent upon the nature of the analyte and is primarily a function of its hydrophobicity. In other words, the more hydrophobic the analyte, the steeper this line will be.
Retention factor as a function of chain length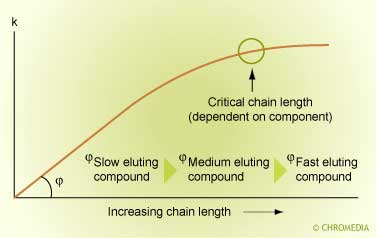 Retention factor (k) as a function of the length of the ligand chain; φ depends on the hydrophobicity of analytes.
Longer chains tend to become entangled which may reduce the interactions with the solutes and thus, the retention factors. Therefore, RPLC phases with carbon chain lengths between 8 and 18 are very popular as ‘standard‘ stationary phases. Phases of chain lengths larger than C-20 can be found in the market, however. The influence of the carbon chain length on retention and selectivity is further illustrated in the figure below. Notice the ratio of the retention factor on the two phases (C18:C8).
C8 and C18: influence chain length on the retention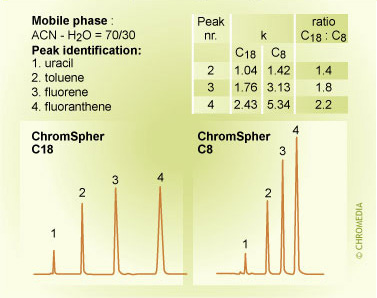 Influence of the ligand chain length on the retention of aromatic hydrocarbons.
This figure shows that at constant eluent conditions the retention and selectivity of the analytes toluene, fluorene and fluoranthene increase with the length of the carbon chains of the RPLC phases.
Retention and selectivity are substantially influenced by the nature and concentration of the organic modifier. This is illustrated in the figure below with the analytes phenol, anisol, and naphtalene in aqueous methanol eluent mixtures.Effect methanol on retention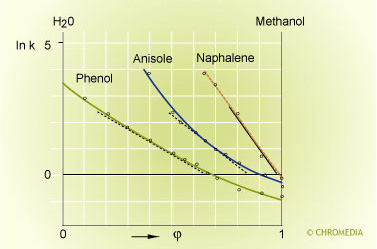 Plot of the logarithm of the retention factors of phenol, anisole and naphtalene as a function of φ, the fraction of methanol in water
This figure shows that:
- Retention increases as the methanol concentration in the eluent decreases.
- The analytes’ sensitivity to the methanol concentration varies.
- The diverging lines imply that the selectivity may change as a function of the methanol concentration.
- These plots of ln K versus modifier concentration are typically only linear over a restricted range.
The linear part of the curve can be described by formula:
ln K = a + b* q
a = intercept on the y- axis
b = slope, representing the solvent strength, S of a specific modifier
q = volume fraction of the modifier in the eluent
More complicated quadratic and cubic mathematical formulas must be applied to adequately represent the nonlinear parts of these functions. The relationship ln k versus q is approximately linear in the concentration range 0.2 < φ < 0.8. As a rule of thumb, a 10 to 15% increase in the organic concentration decreases retention values by approximately a factor 2.
In summary, the function ln k versus φ is determined by the nature of the RPLC column and the nature and concentration of the organic modifier and is specific to each individual analyte.
As in other branches of chromatography, the retention along a homologous series of analytes in RPLC can often be described by a systematic increase with the addition of a specific increment, e.g. a methylene group. This systematic increase in retention follows the Martin equation:![]()
k = retention of analyte
kp= retention of parent compound ![]() = specific group contribution (e.g. methylene group)
= specific group contribution (e.g. methylene group)
This retention behaviour as a function of the analyte carbon number is presented in the figure below for several different homologous series. In the figure, the incremental additivity in each of the specific homologous series is clearly seen. For the most part, subunits other than methylene groups follow the Martin additivity equation as well.
Retention behaviour of homologues series of various classes of compounds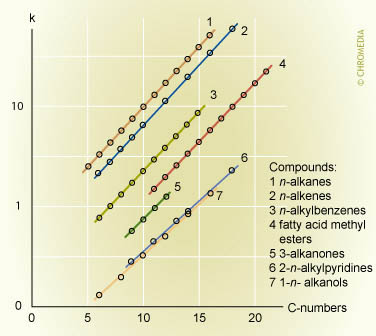 Retention behaviour of homologues series of various classes of compounds on PMSC-18 coated Nucleosils 5-100-C1. Mobile phase, methanol-water (90:10)
Prediction or explanation is not always easy
The rules discussed in this chapter thus far can be used for the estimation of the retention and selectivity of analytes that are not too polar. In spite of the general validity of these rules, retention and selectivity cannot always be easily predicted or explained. This is illustrated in a series of chromatograms herunder:
1. Comparison of hydrophobicity and selectivity of various columns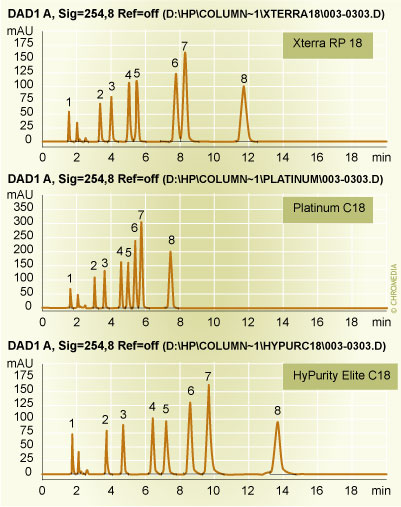 Comparison of hydrophobicity and selectivity of Xterra(TM) RP-18, Platinum C-18 and HyPurity Elite C18. Conditions: Eluent methanol-water; 75:25 v/v/, flow 1.0 ml/min, injection volume 1.0 µl, temerature 300 C, UV detection at 254 nm. Sample: 1=thiourea, 2=toluene, 3=ethylbenzene, 4=propylbenzene, 5=mesitylene, 6=phenanthrene, 7=anthracene, 8=pyrene.
In the above figure a number of aromatic analytes are separated under isocratic conditions on three nominally identical C-18 RPLC phases from different manufacturers. Obviously, the Platinum C-18 column has the lowest retentivity for these apolar analytes and, thus, this column is the least hydrophobic of these three columns. This figure also clearly reveals the substantial inter-column differences in the selectivities for these compounds. For example, the separation between the analytes 4/5 and 6/7 is significantly better on the HyPurity Elite C -18 in comparison to both of the other columns. Quantitatively speaking, the selectivities for the analytes 6/7 viz. phenantrene/mesitylene are 1.58, 1.12 and 1.25 for the XTerra C -18, Platinum C -18 and HyPurity Elite C -18 columns, respectively.
Influence of polar and ionic activity
RPLC columns may have substantially different chromatographic properties, especially in terms of their polar/ionic activity. Therefore, it is not surprising that the retention and selectivity behaviour of these columns towards polar/ionic analytes is not always easy to understand or predict.
The separation of polar/ionic analytes can be complicated substantially by secondary retention mechanisms, with the polar and ionic activity of the phases coming into play. Specifically, these secondary interaction forces may include:
- Dipole – dipole interaction
- Lewis acid (proton donor)
- Lewis base (proton acceptor)
- Ion-ion interactions
- Steric and host-guest interactions
This can be seen in chromatograms of the separation of acidic and basic analytes on C-8 and C-18 RPLC phases. The first one (A) shows the separation of an acidic test sample mixture at an eluent pH = 3. A complete separation of all test analytes is observed on the Eclipse XDB C-8 column in about 13 minutes. In contrast, the separation on both of the other columns is incomplete. Furthermore, on the HyPurity Advance column, the order of the analyte peaks 3, 5 and 2, 4 is reversed compared to the other two columns. This is indicative of the different retention mechanism on the first column.
A. Comparison of polar/ionic activity of various columns (1). 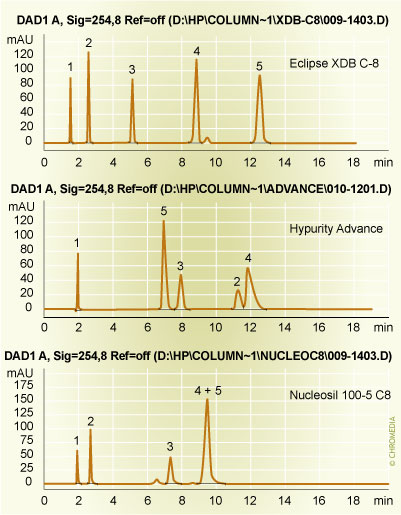 A. Comparison of polar/ionic activity of Eclipse XDB C-8, HyPurity Advance and Nucleosil 100-5 C8 columns. Conditions: eluent methanol/20 mM formate buffer pH = 3.0; 25:75 v/v, flow 1.0 ml/min., injection volume 1.0 µl, temperature 30oC, detection UV at 254 nm. Sample: 1 = thiourea, 2 = 2-nitrobenzoic acid, 3 = 4-hydroxybenzoic acid, 4 = 3-cyanobenzoic acid, 5 = 2-acetoxybenzoic acid.
The next chromatograms (B and C) demonstrate the separation of low and high pKa basic test analytes, respectively, at an eluent pH = 7.
In B (click to see the chromatograms) the low pKa basic analytes are well separated on the Eclipse XDB C-8 and the Nova-Pak C-8 columns, however in different time windows. In contrast, this test mixture is only partly separated on the Nucleosil100-5 C-8 under similar conditions. In particular, the separation of analytes 4 and 5 is incomplete and the selectivity is reversed compared to both other columns. The separation of analytes 5 and 6 appears to be critical in the separation of the high pKa analytes. For the Purospher STAR RP-18 column, 5 and 6 coelute completely, while the peaks are not quite baseline resolved on the other two columns. Furthermore, the retention order for these analytes is reversed on the Symmetry Shield RP-18 column when compared to the Nucleosil 100-5 C-18 column. This indicates a difference in selectivity between these latter two columns. It should be emphasized that in each figure, all columns were tested under the same set of conditions. Thus, the conditions were not necessarily optimal for all columns in a specific ![]() test. However, the examples clearly show the substantial differences that may occur even between nominally identical RPLC phases.
test. However, the examples clearly show the substantial differences that may occur even between nominally identical RPLC phases.
C. Comparison of polar/ionic activity of various columns (3)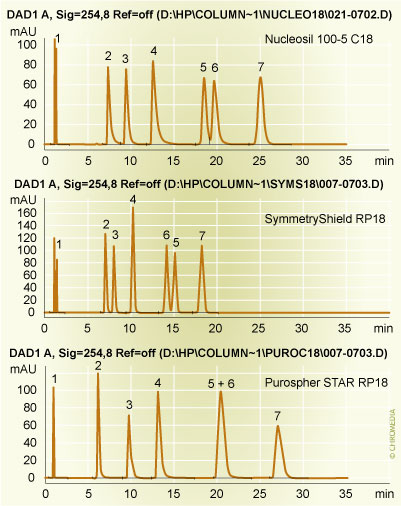 C. Comparison of of polar/ionic activity of Nucleosil 100-5 C18, SymmetryShield RP18 and Purospher STAR RP18 columns. Conditions: eluent methanol/20 mM phosphate buffer pH = 7.0; 70:30 v/v, flow 1.0 ml/min., injection volume 1.0 µl, temperature 30 oC, detection UV at 254 nm. Sample: 1 = thiourea, 2 = nortriptyline, 3 = doxepine, 4 = promazine, 5 = trimeprazine, 6 = amitriptyline, 7 = trimipramine.
In chromatographic practice, however, even larger differences in retention and selectivity can be observed, especially in the case of the separation of acidic and basic analytes. The ![]() separation of basic analytes is particularly problematic and will be treated in a separate paragraph.
separation of basic analytes is particularly problematic and will be treated in a separate paragraph.
The fact that the retention and selectivity of commercially available RPLC phases are only tested and catalogued on a very limited scale complicates column selection for the analyst.
How does one select the best column for a specific separation?
Selection of the optimal column for a separation prior to method development is crucial in order to arrive at rugged and robust analysis protocols. To begin with, column selection is substantially facilitated by general knowledge of the different chemistries applied in the manufacture of RPLC stationary phases. This also includes knowledge about the chemical and thermal stability of RPLC phases resulting from these column chemistries. This is particularly important since stationary phase stability plays more and more of a role in column selection as analysts push the limits of RPLC. Secondly and ideally speaking, a column selection should be based on objective criteria, of which the retention and selectivity would be the most important parameters. Unfortunately, however, the retention, selectivity and other chromatographic properties of RPLC phases are only catalogued on a limited scale at present. In addition, the data are not always easily accessible, interpretable or transferable to a concrete separation problem. In summary, the selection of a proper column is of crucial importance, but requires column testing, characterisation and ranking. Therefore, this important subject will be treated separately in the chapter "COLUMN SELECTION”.