Abstract This article is written by Sabine Heinisch and Jean-Louis Rocca.
The great potential of High Temperature Liquid Chromatography (HTLC) is discussed on the basis of experimental results obtained at temperatures ranging from 30 to 160°C. The various advantages of high temperatures for the separation of basic compounds are highlighted. These advantages include the great improvement in peak shapes, the possibility to vary the selectivity by changing temperature and the significant decrease in gradient re-equilibration time. A particular attention is drawn to the combination of high temperatures and ultra high pressures in order to evaluate the real increase in separation speed. The current limits accounting for the available columns and instruments are highlighted.
KeywordsHTLC, High Temperature LC, Ultra high pressure LC, pharmaceutical compounds.
LevelAdvanced
The interest for the use of HTLC, typically ranging from 40 to 200°C, is growing and many reviews were recently published on this technique [1-5]. It is yet surprising to see that high temperatures are still little used in routine work.
Three major reasons can explain the great interest for HTLC:
- Reduction of the percentage of organic solvent in the mobile phase.
- Reduction of the mobile phase viscosity leading to an increase in the diffusion coefficients and therefore to faster separations.
- Significant reduction in peak asymmetry and the real improvement in the separation of polar and basic compounds.
But of course, some problems arise from the use of HTLC and some limits are involved. On the basis of experimental results obtained at temperatures between 30 and 160°C with various stationary phases, we evaluate in this chapter the practical benefits of HTLC. The advantages are discussed and the current performance limits accounting for the available columns and instruments are highlighted.
High Temperature Liquid Chromatography (HTLC) can be used in many cases, we summarize the following rules of thumb:
- HTLC is an attractive technique for applications whithin a certain temperature range. Temperatures up to 100°C are currently offering a good compromise between the various advantages and the current limitations.
- The variation of solute retention with the temperature parameter solely may be advantageous, particularly in case of aqueous mobile phases. However it should not always replace the use of the mobile phase composition parameter which allows much greater variations in retention factor.
- Temperature programming can be a good alternative to solvent programming provided that the gradient slope is < 5%/min and the composition range is < 40%.
- When considering both the great changes in selectivity with temperature and the significant improvement of peak shapes, working with a neutral pH at high temperature can be more attractive than working at acidic or basic pH at ambient temperature. This makes especially for pharmaceutical compounds, the use of a high temperature very advantageous
- A dramatic reduction of the
 column re-equilibration time is observed with medium temperatures.
 - The gain in speed is attractive depending on the mobile phase conditions. It is particularly interesting in the range of temperatures from ambient temperature up to 100°C. The combined use of HTLC and UHPLC is very promising since both techniques are
 complementary: HTLC leading to faster separations for a given efficiency and UHPLC allowing higher efficiencies.
Two different ranges of temperatures should be distinguished in relation to the availability in both stable columns and suitable instrumentation. In the first range from ambient temperature to 90°C, there are fewer concerns and instrument difficulties than in the second one ranging from 90°C to 200°C:
- 20 - 90°C. In this range some current silica-based columns can withstand temperatures as high as 90°C [6-8]. Moreover, ovens that are commonly included into chromatographic systems can usually reach temperatures as high as 90°C.
- 90° - 200°C. Very few current silica-based stationary phases are stable at such high temperatures [9]. The use of alternative packing materials is therefore necessary [10].
- It was shown that zirconia-based columns coated with a polymer or cladded with carbon are stable at temperatures as high as 180°C [11]. Yet, zirconia-based stationary phases may lead to a bleeding which can be very detrimental to detection, probably due to catalytic degradation known to occur on zirconia [12].
- Other packing material such as porous graphitic carbon or organic polymer can be used at very high temperatures without thermal degradation [13].
For temperatures over 90°C, it is currently necessary to use an external oven that can be either an oil bath, a heating block or a forced circulating air oven such as those used in gas chromatography. Efficient ovens are commercially available. Most of them include devices for preheating and cooling the mobile phase [14]. However, due to their quite large extra column volumes, these ovens are not suitable for narrow bore columns (2.1 mm i.d. or smaller).
In order to keep the same eluent strength and retention factors (isoeluotropic conditions) at high temperature, it is necessary to reduce the content of organic modifier used at room temperature under reversed phase conditions.
- A low content of organic solvent is attractive because it allows to handle more “green” mobile phases.
- In some particular cases, it is even possible to use pure water as mobile phase which is often called “superheated water chromatography”.
In case of neutral compounds, an increase in temperature most usually leads to a decrease in retention similar to an increase in percentage of organic modifier. In Fig.1 , the variation of log(k) with temperature is compared to the variation of log(k) with acetonitrile mobile phase composition at 30°C on two different zirconia-based and on a silica-based stationary phase.
1. Comparison of the variations of log(k) versus the percentage of acetonitrile and temperature (Click to enlarge).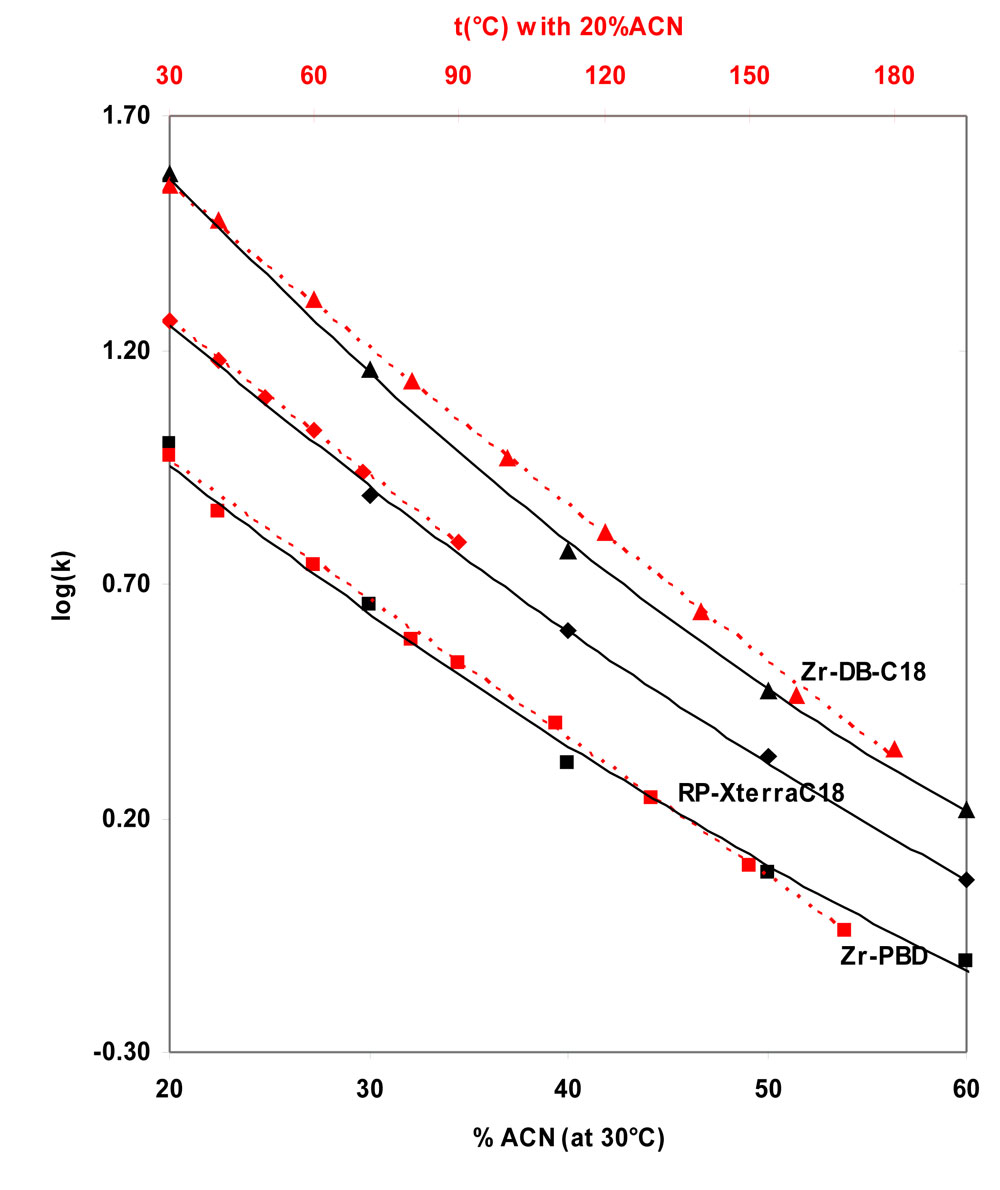
![]() Figure 1: Comparison of the variations of log(k) versus the percentage of acetonitrile (full black lines and bottom scale) and versus the temperature (red
Figure 1: Comparison of the variations of log(k) versus the percentage of acetonitrile (full black lines and bottom scale) and versus the temperature (red ![]() dotted lines and top scale) on three stationary phases: Black triangles: Discovery ZrDB-C18, Black squares Discovery ZRPBD, tilted squares: Xterra-RPC18.
dotted lines and top scale) on three stationary phases: Black triangles: Discovery ZrDB-C18, Black squares Discovery ZRPBD, tilted squares: Xterra-RPC18.
An increase in temperature and the resulting decrease in retention may be advantageous in case of very highly retentive stationary phases as shown in Fig. 2 for the separation of three pharmaceutical compounds on a Hypercarb column (porous graphitized carbon). This figure highlights two major additional advantages of HTLC: the reduction of analysis time due to the increase in flow-rate and the significant improvement of peak shapes.
2. Separation of codeine, chloroprocaine and diphenhydramine.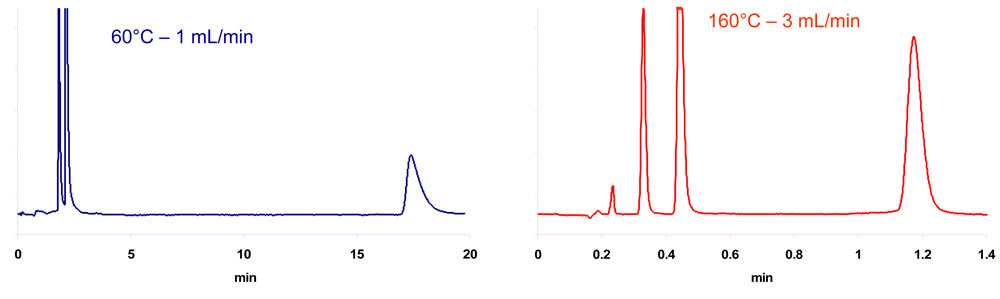
![]() Figure 2: Separation of codeine; chloroprocaine and diphenhydramine on a Hypercarb column (100mm x 3mm, 5µm). Water-acetonitrile (0-90 v/v).
Figure 2: Separation of codeine; chloroprocaine and diphenhydramine on a Hypercarb column (100mm x 3mm, 5µm). Water-acetonitrile (0-90 v/v).
Polar compounds.
It should be pointed out that an increase in temperature leading to a decrease in retention may be detrimental for very polar compounds. These are poorly retained even at ambient temperature, as illustrated in Fig.3 by the gradient separation of basic compounds. Even at 30°C, 100% water is required as initial composition. In these conditions, codeine and chloroprocaine are already poorly retained and as a result not enough retained at 90°C (k<1) thereby leading to a coelution of the two solutes.
3. Gradient separation of basic and neutral compounds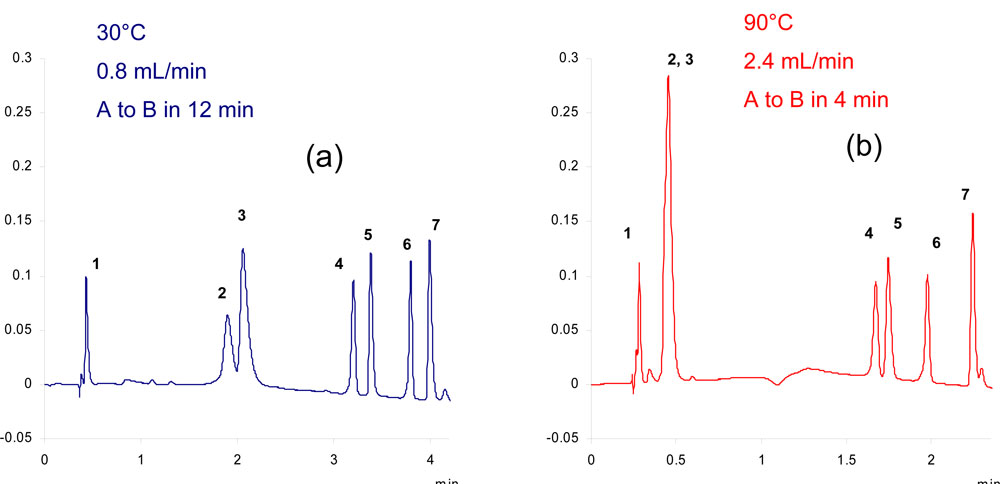 Figure 3: Gradient separation of basic and neutral compounds on a Discovery ZrPBD column 50mm x 4.6mm, 3µm. A: aqueous ammonium Acetate pH6.8; B: acetonitrile. Solutes (1) uracile; (2) codeine; (3) chloroprocaine; (4) NN dimethyl aniline, diphenhydramine, toluene, imipramine, ethylbenzene.
Temperature gradient
A gradient of temperature can be a very attractive alternative for conventional composition gradients, either for micro- or nano-LC or with superheated water. This because of the very low flow-rates, a composition gradient is not easy to implement in such miniaturized techniques. With superheated water, a temperature gradient is the only way to vary the eluent strength during analysis. However the range of compositions needed for a gradient of composition is usually wider than 50% and consequently the corresponding range of temperature should be wider than 200°C (see Fig.1). Current available equipments are still unable to cover such a large range of temperatures. Furthermore, the required ramp of temperature should often be too steep (> 20°C/min) to be applied to LC-separation because heating transfer are very slow in liquids.
Van Deemter curves
The reduction of the mobile phase viscosity with temperature leads to an increase in diffusion coefficients and accordingly to faster analysis. In this section, the gain in analysis speed is discussed and two shortcomings are pointed out:
- The need for higher pressure when working at constant reduced velocity
- The increasingly detrimental contribution of extra-column band-broadening and instrument limitations to efficiency.
In Fig.4 we see experimental plate heights values, H, as a function of linear velocities, ν, obtained on a Hypersil Gold C18 column in different conditions of temperature (30°C, 60°C, 90°C) and particle size (5µm, 1.9µm). The retention factor was kept constant (k=3) by adjusting the mobile phase composition. The experimental data points are fitted using the Knox equation [16]. By calculating the solute diffusion coefficient, Dm according to a method previously described [17, 18] (see the appendix), the reduced plate height can be plotted against the reduced velocity. As can be seen in Fig.4b, this set of experimental data points are well fitted with a unique curve corresponding to a unique reduced Knox equation:
![]() (1)
(1)
where h (H/dp) and ν (u.dp/Dm) are the reduced coordinates, dp, being the particle size. The coefficients a, b and c only depend on the packing quality and the retention factor. They are independent of the temperature for a neutral solute and provided that the packing quality is kept constant also independent of the particle size.
4. (a) H versus u and (b) h versus n.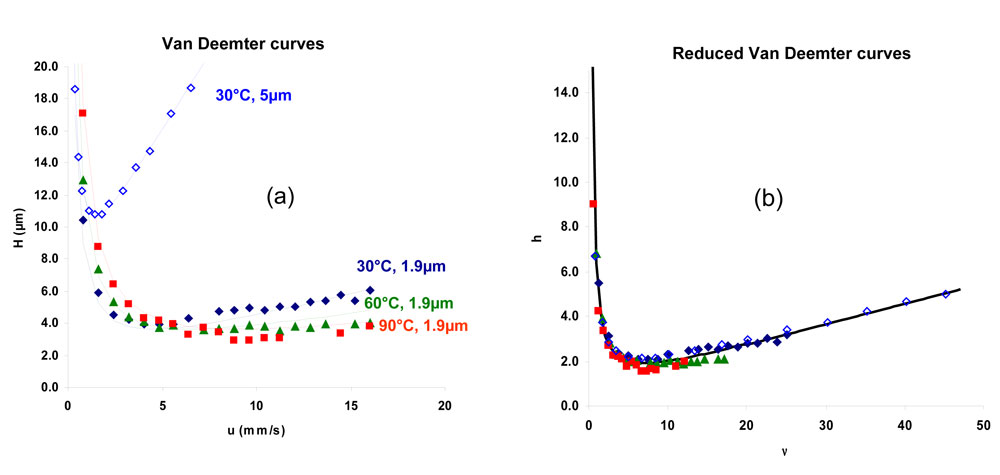 Figure 4: (a) H versus u and (b) h versus ν. Experimental data obtained with an HypersilGold-C18 column. ¸150x3mm, 5µm, 30°C, 70%acetonitrile; t 50x2.1mm, 1.9µm, 30°C, 68% acetonitrile; p 50x2.1mm, 1.9µm, 60°C, 58% acetonitrile; n 50x2.1mm, 1.9µm, 90°C, 53% acetonitrile. Solute : butylbenzene (k=3)
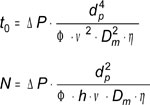
Such a unique curve theoretically predicted [19] was experimentally obtained for temperatures up to 180°C for neutral solutes, with silica-based and some non silica based stationary phases [17, 18]. An increase in temperature leads to an increase in the diffusion coefficients thereby decreasing the reduced velocity. The velocity, u, has to be increased to maintain the same efficiency that means to keep the same reduced velocity. The column dead time, t0, needed for a given column length, L, to reach a given plate number, N (N=L/hdp) is therefore inversely proportional to the diffusion coefficient according to
![]() (2)
(2)
From Eq.2, the gain in speed when changing the temperature corresponds to the ratio of the diffusion coefficient at a given temperature to the diffusion coefficient at lower temperature [19]. From 20°C to T, it is given by
![]() (3)
(3)
The variation of the gain in speed (diffusivity ratio) with the temperature is shown in Fig. 5 for three different mobile phase compositions. As it can be seen, it is strongly dependent on the mobile phase composition, higher with methanol-water than with acetonitrile-water mixtures.
5. Comparison of gain in speed for different mobile phase compositions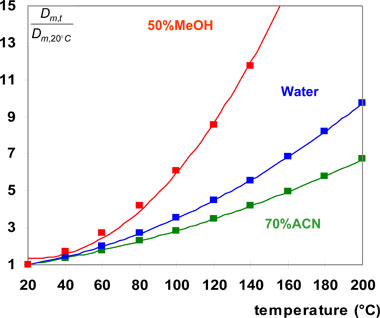 Figure 5: Comparison of the gain in speed (from 20°C to a given temperature) for three different mobile phase compositions.
From 20°C to 100°C, the gain in speed is in the range 2.5 to 6 depending on the mobile phase composition. From 100°C to 160°C, an additional gain in speed (in the order of 2) can be obtained. It is important to notice that the gain in speed is much more significant from 20°C to 100°C than from 100°C to 160°C. On the other hand, the water content in the mobile phase has to be increased in order to keep the eluent strength constant and the corresponding gain in speed is therefore mostly lower than the one expected by keeping the same mobile phase composition. With the present mobile phase compositions (see Fig.4), the diffusivity ratio from 30°C to 90°C was only 2.1.
According to the Wilke-Chang equation [21], ![]() is constant for a given compound and a given solvent, η being the solvent viscosity and T, the absolute temperature. For given column length and efficiency, the column pressure drop is therefore proportional to the absolute temperature according to:
is constant for a given compound and a given solvent, η being the solvent viscosity and T, the absolute temperature. For given column length and efficiency, the column pressure drop is therefore proportional to the absolute temperature according to:
![]() (4)
(4)
K0 being the column permeability. Whereas the pressure increase is small (about 20%) from 30°C to 90°C it becomes significant (about 60%) at 200°C. Experimental results are in good accordance with this theoretical equation as shown in Fig. 6. For a given reduced velocity and in particular for the optimum one indicated in the figure, the column pressure drop at 90°C is higher than at lower temperatures.
6. Column pressure drop as a function of the reduced linear velocity at different temperatures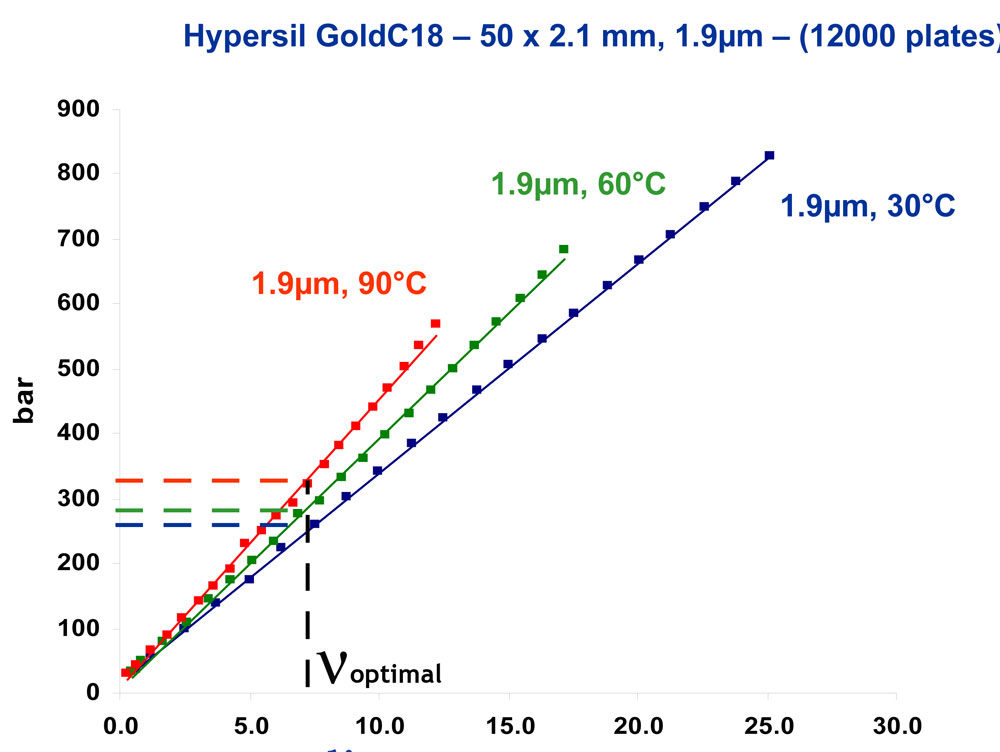
The preceding plots and equations do not take into account the maximum pressure drop allowed by the instrument and therefore are not sufficient to compare HPLC to HTLC. A good way to compare the potential of two different techniques is the use of kinetic plots [18, 22-24]. For a given pressure, a kinetic plot translates any points of the h versus ν plot into a plot of the minimum column dead time, t0 needed to reach a given plate number, N, according to the following equations 5 and 6:
 (5) and (6)
The kinetic plots at 30°C and 90°C were calculated with the Knox coefficients corresponding to the data shown in Fig.4. The resulting plots are shown in Fig.7a for 1.9 µm particle size with a maximum pressure of 800 bar.
7. Theoretical (a) and corrected (b) kinetic plots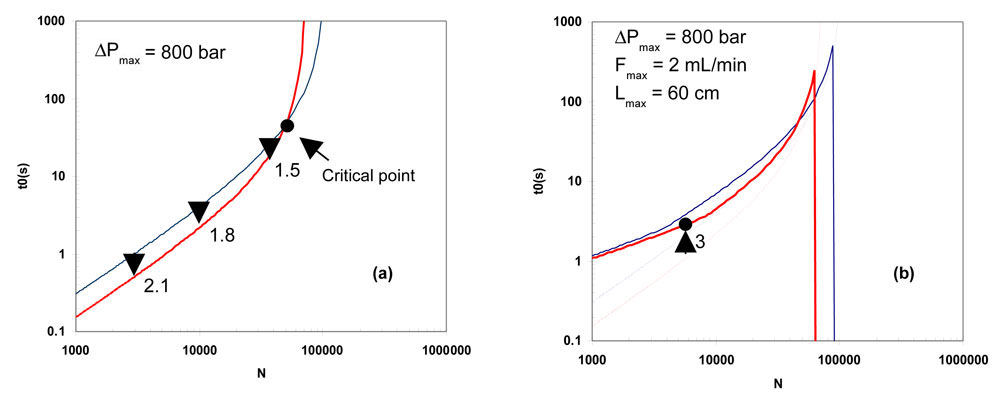 Figure 7: Theoretical (a) and corrected (b) kinetic plots calculated from the fitted curve of Fig.4b at 30°C (thin blue line) and 90°C (bold red line). Dotted lines in (b) represent theoretical curves. (Flow resistance, F0=620; calculated Knox coefficients: a=0.28; b=5.44; c=0.09)
The scale being logarithmic, the vertical difference between the two curves represents the gain in speed for the corresponding plate number. The gain in speed decreases when the required plate number increases as indicated by the arrows on Fig.7a: 2.1 for 3000 plates and below (close to the diffusivity ratio), 1.8 for 10000 and 1.5 for 30000 plates. The two curves cross for a critical plate number close to 50000 plates, meaning that for efficiency lower than 50000 plates, 90°C is beneficial while it is detrimental for higher values.
Some relevant conclusions can therefore be drawn when a unique h vs ν curve exists which is usually the case with neutral solutes:
- At fixed column length (variable column pressure drop) the theoretical gain in speed for a given efficiency is equal to the Dm ratio (2.1 in this example). At the same time, the column pressure drop is increased.
- At fixed column pressure drop (variable column length), the theoretical gain in speed is dependent on the required plate number. It is maximum and equal to the Dm ratio for small efficiencies (short columns). It is smaller (or even reversed) for high efficiencies (long columns).
Some difficulties leading to a reduction of the potential of the technique always arise from the instrumentation design [24, 25]. In addition to the column oven, efficient devices for preheating and cooling the mobile phase are required. They bring additional extra column volumes which in turn lead to additional band broadening and to additional pressure. The extra-column variance always increases with flow-rate. For a given reduced velocity, it is consequently more significant at higher temperature. This is highlighted in Fig. 8a where the extra-column variance of a standard HT-UHPLC instrument, calculated elsewhere as a function of the flow-rate [24], is currently plotted against the reduced velocity of butylbenzene. The required additional tubing for mobile phase preheating also leads to an additional pressure drop in the system. Furthermore a backpressure regulator is always required to maintain the mobile phase in a liquid state all along the column and through the detector cell. As a result the pressure drop in the system is higher when increasing the temperature as shown in Fig.8b.
8. Effect of extra-column volume on (a) extra-column variance and (b) extra-column pressure drop.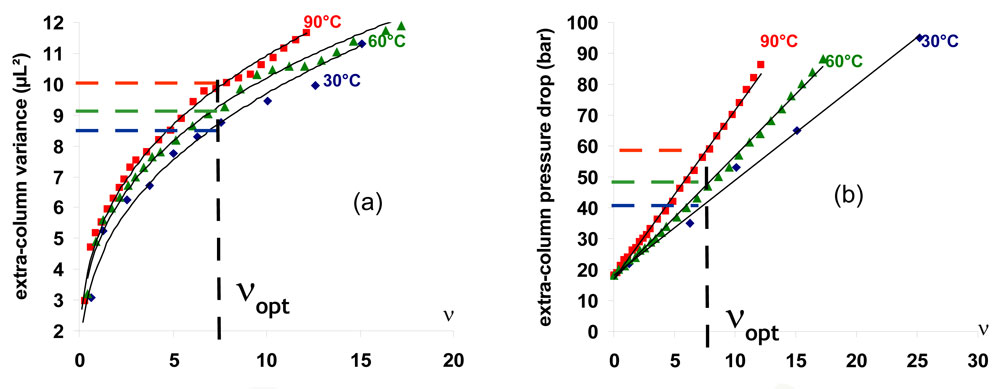 Figure 8: Effect of extra-column volume on (a) extra-column variance and (b) extra-column pressure drop. Eluent: water-acetonitrile (30-70 v/v)
Moreover, because higher temperatures require higher flow-rates, their potential in speed is more affected by any limitation in flow-rate. Finally, the column length is limited by the oven size and the maximum column length will limit the attainable plate number. The effects of instrument limitations and extra-column dispersion are highlighted in Fig. 7b where the curves of Fig.7a are re-calculated by taking into account the standard characteristics of an UHPLC instrument according to a method previously described [24]. As it can be seen, the potential of HTLC is significantly reduced within the whole range of plate values. The low plate range is dominated by flow-rate limitation. It is important to notice that, within this plate range, 90°C is not better than 30°C since it does not provide any gain in speed. A significant loss in the separation speed also occurs in the medium plate range dominated by extra-column dispersion. The high plate range is dominated by column length limitation. For a given maximum column length (i.e. 60 cm in Fig.7) the attainable plate number is significantly reduced when the temperature is increased (60 000 at 90°C and 90 000 at 30°C).
Fig. 9 shows an ultra fast gradient separation of nine aromatic compounds on a sub 2µm stationary phase by combining high temperature (90°C) with high pressure (800bar). This separation is performed in less than 15 seconds. The very narrow peak widths (in the order of 0.5s as shown in the frame of Fig.9) requires a very high acquisition rate (80 Hz) in order to have a suitable number of acquisition data. The flow-rate is 2 mL/min so that the separation is carried out using the maximum flow-rate delivered by the instrument. Despite the very high separation speed it would yet be possible to reduce a little more the analysis time if the flow-rate was not limited (see Fig. 7b and the indicated point corresponding to the conditions of the separation).
9. Fast gradient separation of 9 aromatic compounds at 90°C. 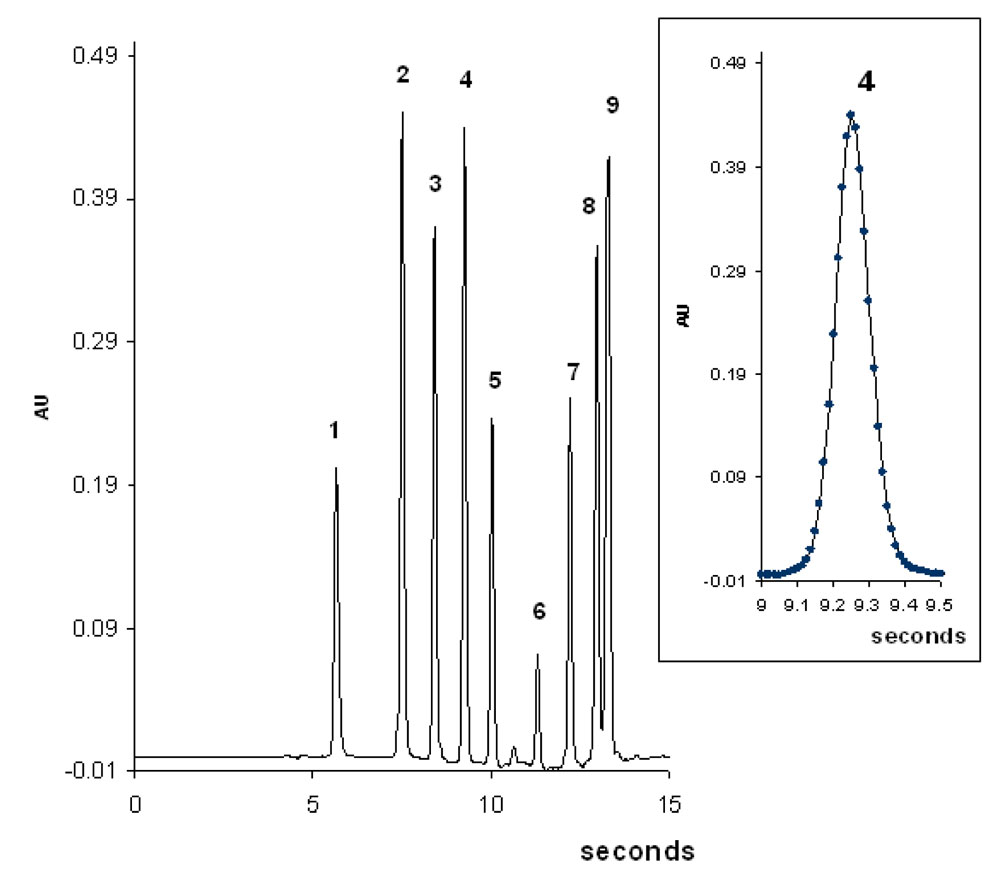 Figure 9: Fast gradient separation of 9 aromatic compounds at 90°C. Water/acetonitrile 80:20 to 5:95 in 7.8s. Flow-rate: 2 mL/min. Initial pressure 650bar. Column : Hypersil Gold C18, 50x2.1mm, 1.9µm. Solutes : 1: caffeine, 2: Methylparaben, 3: ethylparaben, 4: propylparaben, 5: butylparaben, 6: naphtalene, 7: fluorene, 8: pyrene, 9: chrysene. 0.5µL injected. Instrument : Acquity UPLC.
For basic compounds, the increase in temperature is beneficial due to the following major advantages of high temperatures:
- High temperatures lead to a significant improvement in peak shape.
- In case of ionizable solutes, the temperature is a relevant parameter for selectivity tuning
- High temperatures allow to significantly reduce the gradient re-equilibration times.
In contrast, two problems can have a detrimental effect:
- A thermal degradation of the analytes may occur during the separation process. Pharmaceutical and biological compounds are particularly concerned by this problem. The effect of the column temperature on the degradation of the compounds was studied in the past [20, 26]. It emerges that analysis of thermally unstable analytes can be carried out provided that the column residence time is either very small or possibly very high compared to the time required for the achievement of the on-column reaction.
- A new method development is always required when the temperature is changed, a direct transfer of conditions being impossible.
The average peak asymmetry for a set of five basic compounds was measured at neutral pH on different stationary phases and at different temperatures. The experiments were performed in gradient elution using the same gradient conditions for all studied columns (gradient time to column dead time ratio kept constant). The obtained results are given in Fig.10.
10. Comparison of average peak asymmetry 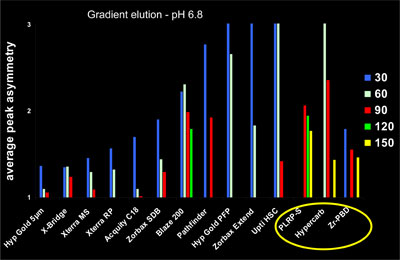 Figure 10: Comparison of average peak asymmetry (Solutes: codeine, diphenhydramine, imipramine, chloroprocaine and clozapine) on various columns at different temperatures. Gradient conditions: water ammonium acetate pH 6.8/acetonitrile 95:5 to 20:80 in 15xt0; optimum flow-rate.
From this figure it can be concluded that
- For all stationary phases, a significant reduction of the peak asymmetry is achieved by elevating the temperature.
- It is interesting to notice the great difference at 30°C between silica-based columns although all these phases are recommended for basic compounds.
- These differences lessen at 90°C with an average peak asymmetry lower than 1.5 for most of them.
- Non silica-based stationary phases (circled in yellow) withstand very high temperatures and can therefore be studied at temperatures up to 150°C.
- When considering the significant peak asymmetry at low temperatures with non silica-based columns, it can be concluded that temperatures greater than 100°C should be strongly recommended for the separation of basic solutes.
A significant reduction of the peak tailing along with a change in selectivity when going from 30°C to 140°C is illustrated in Fig.11 for a gradient separation of pharmaceutical compounds on a zirconia-based column.
11. Gradient separation of basic compounds on a Discovery Zr-PBD column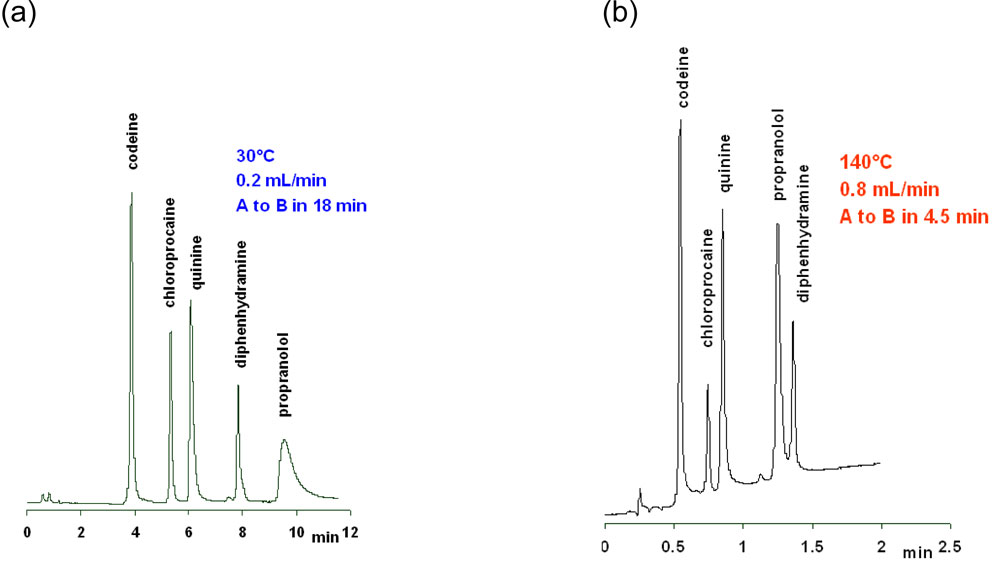 Figure 11: Gradient separation of basic compounds on a Discovery Zr-PBD column (100mm x 2.1mm, 3µm). A: 0.1% ammoniac pH10.4; B: acetonitrile.
The effect of temperature on the retention factor is well described by the Van’t Hoff equation which gives the variation of log(k) as a function of 1/T:
![]() (7)
(7)
Where ΔH0 and ΔS0 are the variations of enthalpy and entropy respectively during the transfer of solute from mobile to stationary phase, R is the universal gas constant and F is the phase ratio. ΔH0 and ΔS0 are usually independent of the temperature and therefore, in case of neutral compounds, log(k) versus 1/T is accurately described by a linear model as shown by the curve of the phenol in Fig.12. In contrast, for a basic compound, the variation is not linear if the compound is partly dissociated because the dissociation rate most often decreases with the temperature [27, 28]. As a result, there is a competition between the decrease in retention due to a classical Van’t Hoff behaviour and the increase in retention due to the decrease in the dissociation rate thereby leading to a sigmoidal shape of the curves [28].
This is well illustrated in Fig.12 by the Van’Hoff plots of various basic solutes on a silica based column (Fig12a) and on a non silica-based column (Fig.12b). The effect of a phosphate buffer (full lines) and an acetate buffer (dotted lines) can be compared in this Figure.
12. Variation of log(k) vs. 1/T for different solutes on two different columns.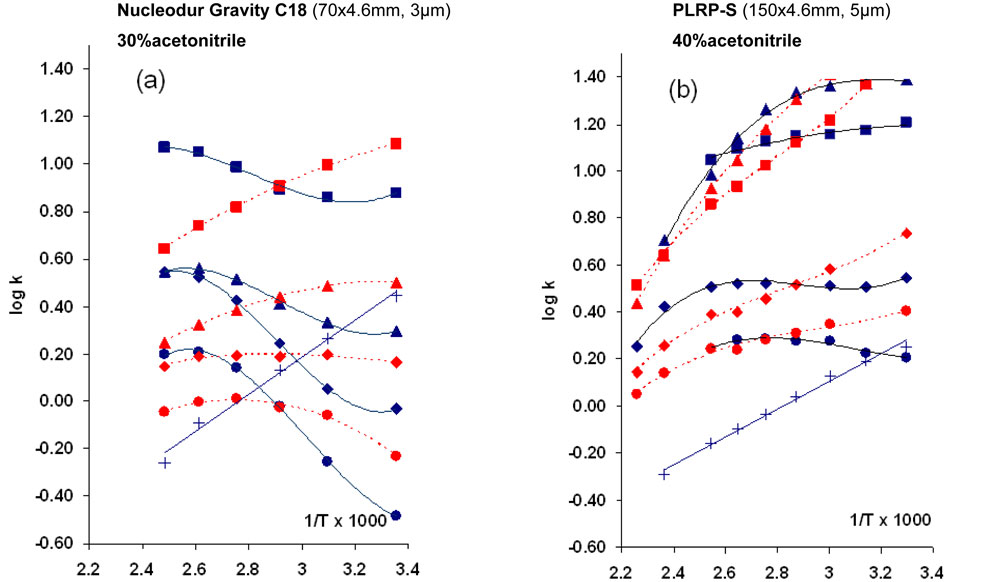 Figure 12: Variation of log(k) vs. 1/T for different solutes on two different columns. Buffer: potassium phosphate 15 mM; pH 6.2 (full blue lines); ammonium acetate 15 mM, pH 6.2 (dotted red lines). Solutes: ·codeine; t chloroprocaine; p quinine; n diphenhydramine,× phenol
As shown, the shape of the curve depends on both the stationary phase and the type of buffer although the same pH (6.2) was adjusted in the aqueous medium.
- When using a phosphate buffer, the retention significantly increases with the temperature. This atypical phenomenon is less significant with an ammonium acetate buffer. This can be explained by the variation of the buffer pKa with temperature which depends on the type of buffer [27-30]. The pKa decreases with temperature in case of basic compounds (analyte or buffer) whereas it remains roughly constant in case of acidic ones.
- The shapes of the curves also depend on the compounds.
- As a result the temperature becomes a useful parameter to vary the selectivity during method development. Temperature is more convenient to adjust than mobile phase pH. Furthermore, optimizing temperature instead of pH usually leads to more rugged analysis because a 2 °C change in temperature can lead to the same change in the dissociation rate of basic compounds as a 0.05 unit change and it is much easier to control the temperature within < 2 degrees than it is to control the pH within < 0.05 pH units.
The great interest of temperature as an optimization parameter is highlighted in Fig.13. Here gradient slope and temperature were simultaneously optimized with an optimization software in order to find the best conditions for the separation of 8 b-blockers according to resolution, analysis time and robustness.
13. Response surface (a) and corresponding optimized separation (b) of b-blockers.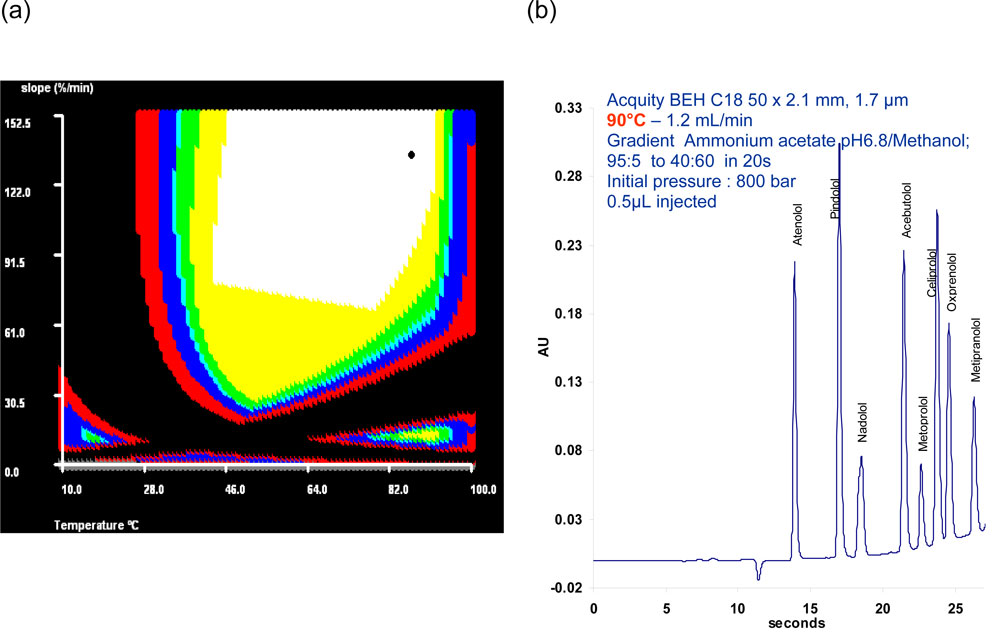 Figure 13: Response surface (a) and corresponding optimized separation (b) of b-blockers. Osiris software.
The corresponding response surface is given in Fig 13a. Black areas correspond to unsuitable conditions with at least one pair of unresolved peaks whereas white areas indicate conditions leading to robust separations in short analysis times. Thus, a very fast separation is obtained at 90°C (Fig.13b) in less than 30 seconds.
The re-equilibration time needed for full column equilibrium is expected to be reached when the retention times no longer vary when the re-equilibration time is further increased. The significant reduction with temperature of the number of column volumes needed for full re-equilibration is shown in Fig.14 for the separation of a sample of basic, acid and neutral solutes. In this figure, the y-axis is related to the average absolute difference in retention times between the test separation achieved with a given re-equilibration time and the control separation achieved with a re-equilibration time long enough to reach the full column equilibrium.
The indicated values were expressed according to the ratio of the difference in retention times to the column dead time. The horizontal black line indicates the measured repeatability (0.01). As it can be seen, the difference in retention times decreased with the number of column volumes. However more than 15 column volumes are required at 30°C to reach the full equilibrium while 5 column volumes are sufficient at 60°C and only 2 at 90°C. It should be noted that the required number of column volumes is totally dependent on both compounds and gradient conditions. However a drastic reduction of the required re-equilibration time with temperature exists regardless of the mobile phase conditions and of the sample. This reduction is related to both decrease in the number of column volumes and increase in flow-rate (required to maintain a constant plate number).
As a result the re-equilibration time may be divided by a factor 20 to 30 when going from ambient temperature to 90°C.
Reduction of the re-equilibration time with temperature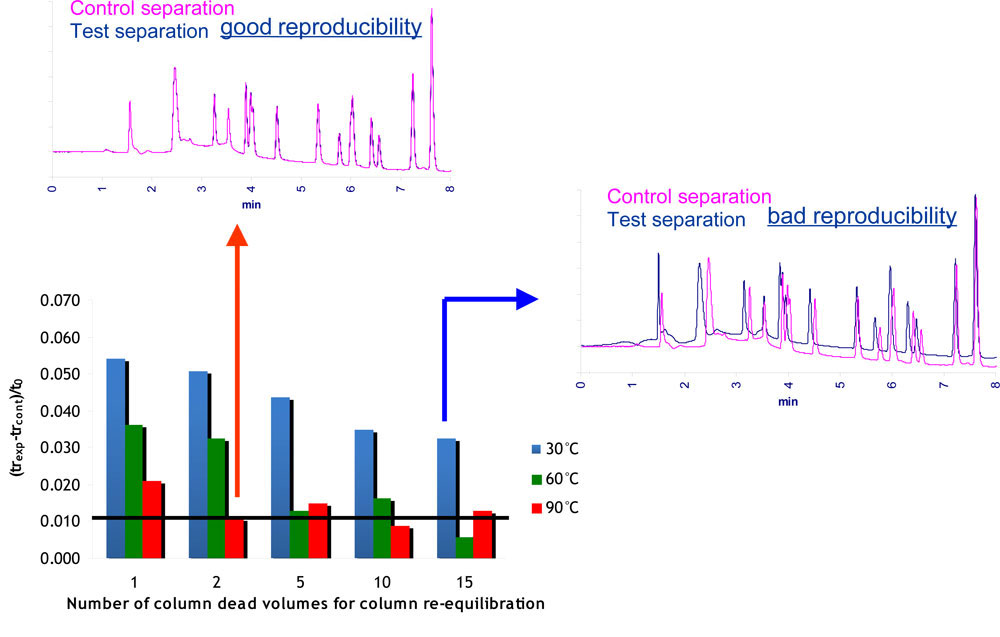 Figure 14: Drastic reduction with temperature of the re-equilibration time needed to achieve full column equilibrium.
HTLC is an attractive technique which presents yet some limitations. Temperatures up to 100°C are currently offering a good compromise between the various advantages and the current limitations. The following conclusions can be drawn:
- The variation of solute retention with the temperature parameter solely may be advantageous, particularly in case of aqueous mobile phases. However it should not always replace the use of the mobile phase composition parameter which allows much greater variations in retention factor. Temperature programming can be a good alternative to solvent programming provided that the gradient slope is < 5%/min and the composition range is < 40%.
- For pharmaceutical compounds the use of a high temperature is very advantageous. When considering both the great changes in selectivity with temperature and the significant improvement of peak shapes, working with a neutral pH at high temperature can be more attractive than working at acidic or basic pH at ambient temperature. A dramatic reduction of the column re-equilibration time is observed with medium temperatures. It is important to notice that silica-based columns can get benefit of these different advantages with temperatures less than 100°C. In contrast, for most non silica-based columns, temperatures greater than 100°C are essential to basic compounds for achieving good efficiencies.
- The gain in speed is attractive depending on the mobile phase conditions. It is particularly interesting in the range of temperatures from ambient temperature up to 100°C. The combined use of HTLC and UHPLC is very promising since both techniques are complementary: HTLC leading to faster separations for a given efficiency and UHPLC allowing higher efficiencies. However the gain in speed may be significantly altered with the available equipment and therefore some effort should be dedicated to the reduction of instrument limitations in order to recover the full potential of these techniques.
The extra-column pressure drop values, DPext were measured without the separation column. The column pressure drop values, DPcol were calculated from the total pressure drop according to DPcol = DPtot - DPext. The peak efficiency was calculated using the Dorsey-Foley equation.
The extra-column variance was measured without the separation column by calculating the second order moment (using internally developped program) for the peak of an injected solute.
The diffusion coefficient ratio was found out from the Wilke-Chang equation [21] and from viscosity values calculated with empirical equations giving the eluent viscosity as a function of both temperature and mobile phase composition:
The diffusion coefficient ratio and the diffusion coefficient values were calculated using an expression derived from the original Wilke-Chang equation.
Click here for details of the calculations.
[1] T. Greibrokk, T. Andersen, J. Chormatogr.A 1000 (2003) 743-755.
[2] G. Vanhoenacker, P. Sandra, J. Sep. Sci. 29 (2006) 1822-1835.
[3] Y.Yang, J. Sep. Sci. 30 (2007) 1131-1140.
[4] C.V. McNeff, B. Yan, D. R. Stoll, R. A. Henry, J. Sep. Sci. 30 (2007) 1672-1685.
[5] D. Guillarme, S. Heinisch, Sep. and Pur. Rev. 34 (2005) 181-216.
[6] Y. Liu, N. Grinberg, K.C. Thompson, R.M.Wenslow, U.D. Neue, D. Morrison, T.H. Walter, J.E. O’Gara, K.D. Wyndham, Anal. Chim. Acta 554 (2005) 144.
[7] D T.-T. Nguyen, D. Guillarme, S. Heinisch, M-P. Barrioulet, J-L Rocca , S. Rudaz, J-L Veuthey, J. Chromatogr.A 1167 (2007) 76–84.
[8] H.A. Claessens, M.A. Van Straten, J. Chromatogr.A 1060 (2004) 23-41.
[9] J. A. Lippert, T. M. Johnson, J. B. Smith, B. T. Johnson, J. Furlow, A. Proctor, S. J. Marin, J. Sep. Sci. 30 (2007) 1141-1149.
[10] T. Teutenberg, J. Tuerk, M. Holzhauser, S. Giegold, J. Sep. Sci. 30 (2007) 1101-1114.
[11] J. Li, P.W. Carr, Anal. Chem. 69 (1997) 837-843.
[12] S. Marin, B. A. Jones, W. D. Felix, J. Clark, J. Chromatogr.A 1030 (2004) 255-262.
[13] L. Pereira, S. Aspey, H. Ritchie, J. Sep. Sci. 30 (2007) 1115-1124.
[14] T. Teutenberg, H.J. Goetze, J. Tuerk, J. Ploeger, T.K. Kiffmeyer, K.G. Schmidt, W.Kohorst, T. Rohe, H-D Jansen, H. Weber, J.Chromatog.A 1114 (2006) 89-96.
[15] M. Albert, G. Cretier, D. Guillarme, S. Heinisch, J-L Rocca, J. Sep. Sci. 28 (2005) 18003-1811.
[16] P.A. Bristow, J.H. Knox, Chromatographia 10 (1977) 279-298.
[17] D. Guillarme, S. Heinisch, J.L. Rocca, J. Chromatogr.A 1052 (2004) 39-51.
[18] D. Cabooter, S. Heinisch, J.L. Rocca, D. Clicq, G. Desmet, J.Chromatogr.A 1143 (2007) 121-133.
[19] J.H. Knox, H.P. Scott, J. Chromatogr. 282 (1983) 297-313.
[20]. D. Antia, C. Horvath, J. Chromatogr.A 435 (1988) 1-15.
[21] C.R. Wilke, P. Chang, AIChe J. 1 (1955) 264.
[22] Lestremeau, A. de Villiers, F. Linen, A. Cooper, R. Szucs, P. Sandra, J. Chromatogr.A 1138 (2007) 120-131.
[23] Guillarme, D. T.-T. Nguyen, S. Rudaz, J-L Veuthey, J. Chromatogr.A 1149 (2007) 20-29.
[24] S. Heinisch, G. Desmet, D. Clicq, J-L Rocca, J. Chromatogr.A submitted.
[25] D. Clicq, S. Heinisch, JL Rocca, D. Cabooter, P. Gzil, G. Desmet, J. Chromatogr.A 1146 (2007) 193-201.
[26]J. D. Thompson, P. W. Carr, Anal. Chem. 74 (2002) 1017-1023.
[27] W. R. Melander, J. Stoveken, C. Horvath, J. Chromatogr.A 185 (1979) 111.
[28] S. Heinisch, JL Rocca, J. Chromatogr.A 1048 (2004) 183-193.
[29] C. B. Castells, C. Rafols, M. Roses, E. Bosch, J. Chromatogr.A 1042 (2004) 23.
[30] L.G. Gagliardi, C.B. Castells, C. Rafols, M. Roses, E. Bosch, J. Chromatogr. A 1077 (2005) 159.