Abstract Authors: M.A. van Straten*, A. Dams" and H.A. Claessens*
*Laboratory of Polymer Chemistry, Faculty of Chemical Engineering, University of Technology Eindhoven, the Netherlands.
"Dams Analytical Consultancy, Nuenen, the Netherlands.
At present an estimated number of 600 RPLC columns are available on the market. A substantial number of these columns are nominally identical by possessing the same type of ligand e.g. C-8 or C-18 bonded to a substrate. But even nominally identical RPLC phases may show very different retention and selectivity properties.
This chapter compares about fifty RPLC columns, all packed with approximately 5 μm packing material that we have tested following an extended in-house testing protocol.
The columns were tested using neutral, acidic, basic and other test analytes at different eluent pH’s.
The aim of this chapter is to serve as a comparison guide for column selection to help you in identifying the optimal RPLC column for a specific separation.
LevelAdvanced
This is a somewhat condensed version of a more detailed article. For more details and off line reading a complete version of this chapter can be downloaded an printed by members as a 50 page pdf
This link does not work for free trial subscribers.
At present an estimated number of 600 RPLC columns are available on the market. A substantial number of these columns are nominally identical by possessing the same type of ligand e.g. C-8 or C-18 bonded to a substrate. But even nominally identical RPLC phases may show very different retention and selectivity properties. As an example this is illustrated in fig. 1 for a number of aromatic hydrocarbons.
Neutral test mixture shows very different retentions with nominally identical columns. (Click image to enlarge)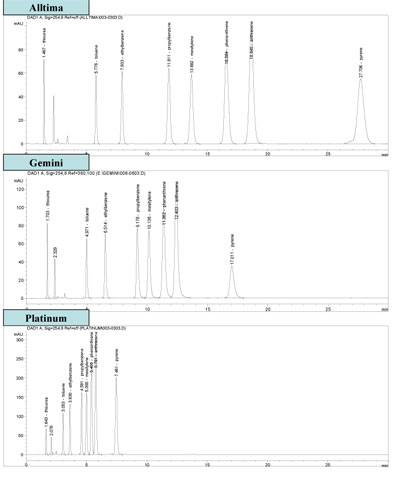 Neutral test mixture shows very different retentions with nominally identical columns. (Click image to enlarge)Fig.1. Separation of a neutral test mixture of alkylbenzenes and polynuclear aromatic hydrocarbons on three nominal identical C-18 RPLC columns. Test conditions as for test 1; test analytes are indicated in the figure; thiourea is used as dead time marker.
Even these neutral test analytes in the test of figure 1 show ![]() substantial differences in retention and selectivity between these three nominally identical C-18 columns. Not surprisingly for more polar and ionic analytes the differences in chromatographic properties of nominally identical RPLC columns can be substantially larger.
substantial differences in retention and selectivity between these three nominally identical C-18 columns. Not surprisingly for more polar and ionic analytes the differences in chromatographic properties of nominally identical RPLC columns can be substantially larger.
The key point is that in general, under further similar conditions, RPLC stationary phases show very different retention and ![]() selectivity behavior. The reason for these observations are the complex nature of RPLC stationary phases and the many different possible interactions between these phases, the eluent and the sample analytes. A more in depth discussion on this topic can be found in (ref. 1) and references therein.
selectivity behavior. The reason for these observations are the complex nature of RPLC stationary phases and the many different possible interactions between these phases, the eluent and the sample analytes. A more in depth discussion on this topic can be found in (ref. 1) and references therein.
In RPLC a number of physical and chemical column parameters determine its retention, selectivity and efficiency properties :
- hydrophobicity
- polar / silanol activity
- hydrogen bonding activity
- shape selectivity
- metal activity
- packing material properties
The resolution in chromatography is governed by retention,selectivity and efficiency,whereas this latter term also depends on the peak asymmetry. Apart from the nature of the sample analytes and the eluent composition these parameters also strongly depend on the properties of the column .
Analysis protocols must:
- Be robust and rugged
- Deliver reliable and reproducible analysis results.
- Preferably be short
- Meet objective goals and criteria
This demands a lot of the mechanical, thermal and chemical stability of RPLC phases.
Therefore to select a proper column we need to consider the stationary phase chemistry, its chemical and thermal stability, the column reproducibility and repeatability and also its dimensions. In practice usually compromises between these considerations must be made.Consequently the selection of a suitable column for each particular separation is of crucial importance.
In order to select the best column for a particular separation from the many hundreds available ones analysts can consult many different information sources: e.g. the scientific and technical literature, the local available column expertise and also the internet; see for examples references (1-7) and the references therein. For a number of separation problems suitable candidate column may be found in this way.
In HPLC-practice candidate columns are often subjected to a testing protocol. Among these tests a substantial number of model and empirical based methods including also the so-called in-house tests can be distinguished (ref. 1). Many of these tests, however, share the problem that their mutual column characterization results are poorly correlated. In addition, the interpretation of these results into the physical-chemistry properties of a column is not at all straightforward (ref. 8).
This chapter compares an approximate number of fifty RPLC columns, all packed with approximately 5μm packing material (next paragraph) that have been tested following an extended in-house testing protocol.
The columns were tested using neutral, acidic, basic and other test analytes at different eluent pH’s. From these tests the following column parameters were calculated: retention factor, USP-tailing factor, plate number per meter column length, metal activity, shape selectivity and hydrogen bonding capacity. The results of the tests are presented in the form of bar graphs, facilitating an easy and fast comparison of the columns.
The aim of this chapter is to serve as a comparison guide for column selection, not to identify the best column for a specific application neither to find an overall best RPLC column. It may help you in identifying the optimal RPLC column for a specific separation.
In fact this paper can give you guidance in three ways:
- If you use, in your laboratory, one of the tested columns you can estimate the chromatographic behaviour of your sample components
- If you are using other columns which have not been tested in this ranking, you can follow the here described test standard protocols to fit them in.
- This guide can also be used to identify suitable alternatives to replace a specific RPLC column. In other words to identify columns possessing more or less similar chromatographic properties compared to a column in use. This can also be useful in finding a “second best” column in order to reduce the risks of analysis down time due to column failure.
| Column name | Manufacturer |
| Zorbax Eclipse XDB-C8 | Agilent Technologies |
| Zorbax Eclipse XDB-C18 | Agilent Technologies |
| Zorbax SB-C8 | Agilent Technologies |
| Zorbax SB-C18 | Agilent Technologies |
| Zorbax Eclipse Plus C18 | Agilent Technologies |
| Zorbax SB-Aquatention | Agilent Technologies |
| Zorbax Extend-C18 | Agilent Technologies |
| Zorbax Bonus RP | Agilent Technologies |
| Agilent PREP-C18 | Agilent Technologies |
| Symmetry C8 | Waters |
| SymmetryShield RP8 | Waters |
| SymmetryShield RP18 | Waters |
| XTerra MS-C18 | Waters |
| XTerra RP8 | Waters |
| XBridge BEH C18 | Waters |
| Nova-Pak C8 | Waters |
| Atlantis dC18 | Waters |
| SunFire C18 | Waters |
| Luna C18 | Phenomenex |
| Luna Phenyl-hexyl | Phenomenex |
| Prodigy Phenyl-3 | Phenomenex |
| Synergi MAX RP | Phenomenex |
| Gemini C18 | Phenomenex |
| Nucleosil C18-HD | Macherey-Nagel |
| Nucleosil C8 | Macherey-Nagel |
| Nucleodur C18 Isis | Macherey-Nagel |
| Purospher Star RP-18 | Merck |
| Superspher 60 RP-SelectB | Merck |
| Hypersil BDS C18 | Hypersil |
| Hypersil ODS | Hypersil |
| Hypurity Elite C18 | Hypersil |
| HyPurity Advance | Hypersil |
| Alltima C18 | Alltech |
| Platinum C18 | Alltech |
| Venusil AQ | Agela Technologies |
| Venusil XBP | Agela Technologies |
| YMC Pro C-18 | YMC |
| Inertsil ODS-3 | GC Science |
| Sepax C18 | Sepax Technologies |
| Acclaim C18 | Dionex |
| Kromasil C18 | Akzo Nobel |
| Pursuit XRs C18 | Varian |
| ACT Ace 5 C18 | HiChrom |
| Omnispher-5 C18 | Chrompack |
| Prontosil C18-Ace-EPS | Bischoff |
| Zirchrom PDB | Zirchrom |
Instrumentation
All column tests were performed on an Agilent 1100 series apparatus equipped with degasser, binary pump, auto sampler, column compartment and UV-DAD detector (Agilent Technologies)
Data acquisition
Data acquisition and calculations were performed using the Chemstation software rev. A 10.01 (Agilent Technologies)
![]() Calculations
Calculations
Test conditions
Details of the test conditions and samples are described in the following test paragraphs.
| sample | thiourea toluene ethylbenzene propylbenzene anthracene pyrene | |
| eluent | Methanol/Water = 75/25 (v/v) | |
| flow | 1 ml/min | |
| inj. volume: | 1 µl | |
| temperature: | 30 oC | |
| detection: | DAD 254 nm |
Test 1.1
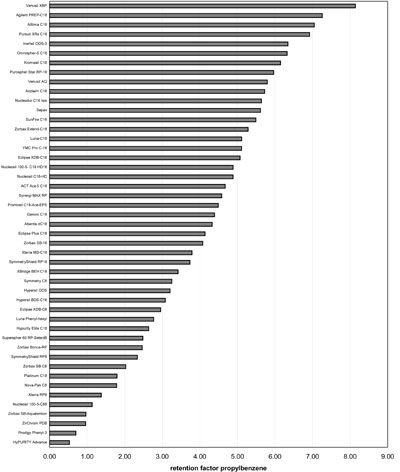
Hydrophobicity is a common property of RPLC columns. In first instance hydrophobicity is determined by the surface coverage and the length of the organic ligands attached to a substrate. Furthermore, this property also depends on the accessibility of these ligands. The retention factor of a neutral analyte in this test propylbenzene is used as a measure for the hydrophobicity of the RPLC columns (ref. 8). Whereas high retention factors values are indicative for large column hydrophobicity.
Column ranking according to hydrophobicity (Click to enlarge)
Test 1.2
Peak asymmetry can be caused by imperfection of the column bed, non-optimal thermodynamics, external column band broadening effects and sample overload of a column. Increasing peak asymmetry results in decreasing column efficiencies and peak capacity. The USP-tailing factor is a convenient measure to express the asymmetry of analyte peaks. Ideally this value should be close to one for symmetric peaks. Summarizing, the actual plate number of a column and hence its peak capacity is also determined by the rate of asymmetry of the analyte peaks.
Column ranking according to USP-Tailing factor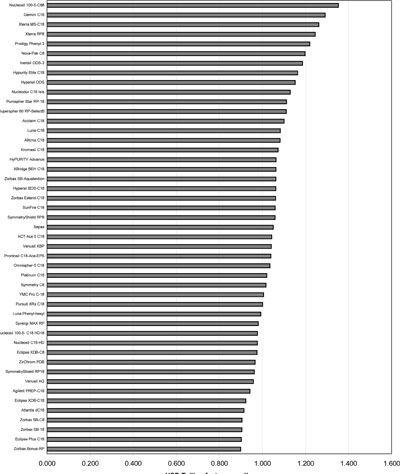
Test 1.3
Ranking of columns according to efficiency. Usually the efficiency (N) of a column is expressed as the number of plates per meter. Measuring N for a neutral component, in this test propylbenzene greatly rules out secondary retention mechanisms. Therefore, these N-values reflect best the kinetic performance of the RPLC columns under study.
Ranking according to efficiency measured for propylbenzene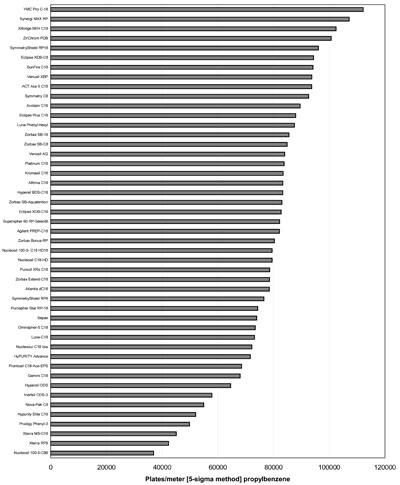
| sample | thiourea 2-nitrobenzoic acid 4-hydroxybenzoic acid 3-cyanobenzoic acid (pKa-value in water, 3.6) 2-acetoxybenzoic acid | |
| eluent | Methanol/20 mM sodium formiate pH 3.0 = 25/75 (v/v) | |
| flow | 1 ml/min | |
| inj. volume: | 1 µl | |
| temperature: | 30 oC | |
| detection: | DAD 254 nm |
Test 2.1
In RPLC apart from hydrophobicity effects the retention and selectivity of polar and ionic analytes is also determined by additional secondary interaction mechanisms. Hence the retention of the acidic test analyte 3-cyanobenzoic acid (pKa-value = 3.6) is determined by its dissociation rate and also by the properties of the stationary phase substrate. Note that by the eluent pH of 3.0 the dissociation of 3-cyanobenzoic acid greatly is reduced. The additional retention effects for polar/ionic analytes viz. 3-cyanobenzoic acid can be further illustrated by comparing the column rankings in the tables 1.1 and 2.1.
Ranking according to the retention factor of 3-cyanobenzoic acid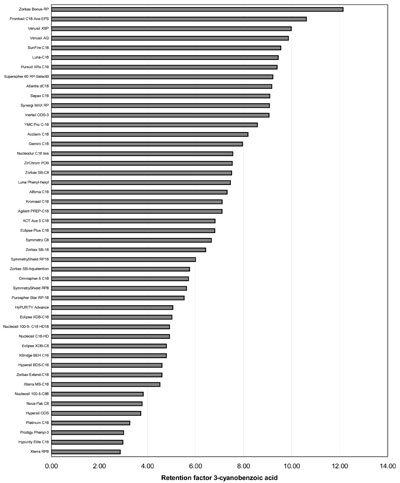
Test 2.2
Peak asymmetry can be caused by imperfection of the column bed, non-optimal thermodynamics, external column band broadening effects and sample overload of a column. Increasing peak asymmetry results in decreasing column efficiencies and peak capacity. The USP-tailing factor is a convenient measure to express the asymmetry of analyte peaks. Ideally this value should be close to one for symmetric peaks. Summarizing the actual plate number of a column and hence its peak capacity is also determined by the rate of asymmetry of the analyte peaks.
Ranking according to the USP-tailing factor of 3-cyanobenzoic acid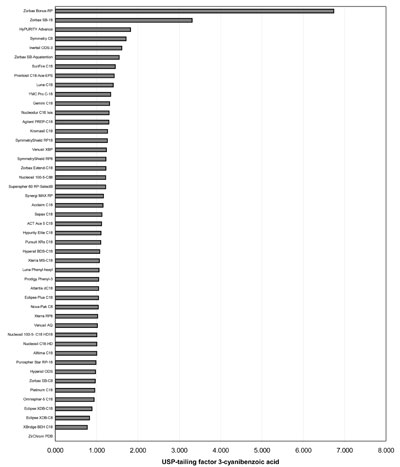
Test 2.3
Usually the efficiency (N) of a column is expressed as the number of plates per meter. In this test the N-values for 3-cyanobenzoic acid ( pKa-value – 3.6) reflect the more complex thermodynamics for acidic analytes on RPLC columns. Note that by the eluent pH of 3.0 the dissociation of the test analyte 3-cyanobenzoic acid is greatly reduced. The additional effects for acidic analytes efficiency can be further illustrated by comparing this table with table 1.3.
Ranking according to the efficiency measured for 3-cyanobenzoic acid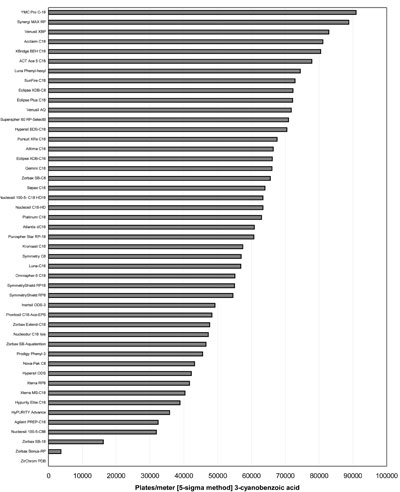
sample thiourea
nortriptyline HCl
doxepine HCl
promazine HCl
trimeprazine tartrate
amitriptyline HCl (pKa-value in water, 9.4)
trimipramine
eluent Methanol/20 mM sodium phosphate pH 7.0 = 70/30 (v/v) flow 1 ml/min inj. volume: 1 µl temperature: 30 oC detection: DAD 254 nm
Test 3.1
In RPLC apart from hydrophobicity effects the retention and selectivity of polar and ionic analytes is also determined by additional secondary interaction mechanisms. Hence the retention of the basic test analyte amitriptyline (pKa-value = 9.4) is determined by its rate of dissociation and also by the properties of the stationary phase substrate. Note that at the eluent pH of 7.0 in this test amitrityline will be protonated. The additional retention effects for amitriptyline and other basic analytes can be further illustrated by comparing the column rankings in the tables 1.1 and 3.1.
Ranking according to the retention factor of amitriptyline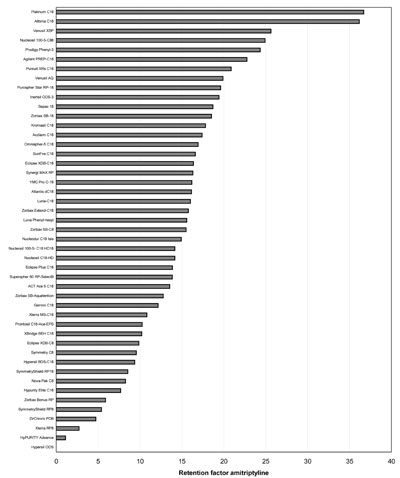
Test 3.2
Peak asymmetry can be caused by imperfection of the column bed, non-optimal thermodynamics, external column band broadening effects and sample overload of a column. Increasing peak asymmetry results in decreasing column efficiencies and peak capacity. The USP-tailing factor is a convenient measure to express the asymmetry of an analyte peak. Ideally this value should be close to one for symmetric peaks. Summarizing the actual plate number of a column and hence its peak capacity is also determined by the rate of asymmetry of the analyte peaks.
Ranking according to the USP-tailing factor of amitriptyline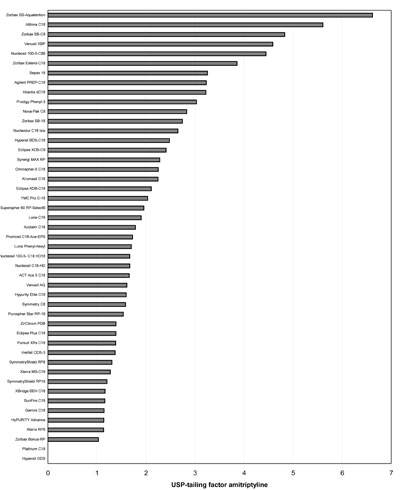
Test 3.3
Usually the efficiency (N) of a column is expressed as the number of plates per meter. In this test the N-values for amitriptyline (pKa-value = 9.4) reflect the more complex thermodynamics for basic analytes on RPLC columns. Note that at the eluent pH of 7.0 the high pKa test analyte amitriptyline will be protonated. The additional efficiency effects for basic analytes can be further illustrated by comparing this table with table 1.3.
Ranking according to the efficiency measured for amitriptyline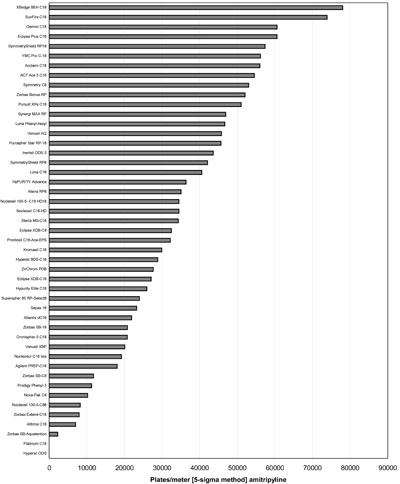
| sample | thiourea 2-hydroxy-4-methylpyridine phthalazine 3-aminoquinoline 4-ethylaniline (pKa-value in water, 5.0) | |
| eluent | Methanol/20 mM sodium phosphate pH 7.0 = 30/70 (v/v) | |
| flow | 1 ml/min | |
| inj. volume: | 1 µl | |
| temperature: | 30 oC | |
| detection: | DAD 254 nm |
Test 4.1
In RPLC apart from hydrophobicity effects the retention and selectivity of polar and ionic analytes is also determined by additional secondary interaction mechanisms. Hence the retention of the basic test analyte 4-ethylaniline (pKa-value = 5.0) is determined by its rate of dissociation and also by the properties of the stationary phase substrate. Note that at the eluent pH of 7.0 in this test the testing analyte 4-ethylaniline will be deprotonated. The additional retention effects for 4-ethylaniline and similar analytes can be further illustrated by comparing the column rankings in this table and the tables 1.1, 2.1 and 3.1.
Ranking according to the retention factor of 4-ethylaniline. pH=7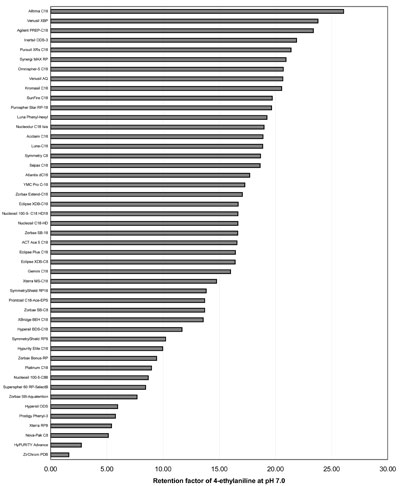
Test 4.2
Peak asymmetry can be caused by imperfection of the column bed, non-optimal thermodynamics, external column band broadening effects and sample overload of a column. Increasing peak asymmetry results in decreasing column efficiencies and peak capacity. The USP-tailing factor is a convenient measure to express the asymmetry of an analyte peak. Ideally this value should be close to one for symmetric peaks. Summarizing the actual plate number of a column and hence its peak capacity is also determined by the rate of asymmetry of the analyte peaks.
Ranking according to the USP-tailing factor of 4-ethylaniline. pH=7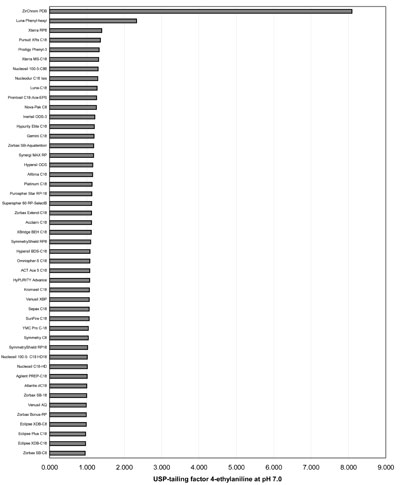
Test 4.3
Usually the efficiency (N) of a column is expressed as the number of plates per meter. In this test the N-values for 4-ethylaniline (pKa-value = 5.0) reflect the more complex thermodynamics for basic analytes on RPLC columns. Note that at the eluent pH of 7.0 the low pKa test analyte 4-ethylaniline will be deprotonated. The additional efficiency effects for 4-ethylaniline and similar low pKa basic compounds can be further illustrated by comparing this table with the tables 1.3, 2.3, and 3.3.
Ranking according to the efficiency measured for 4-ethylaniline. pH=7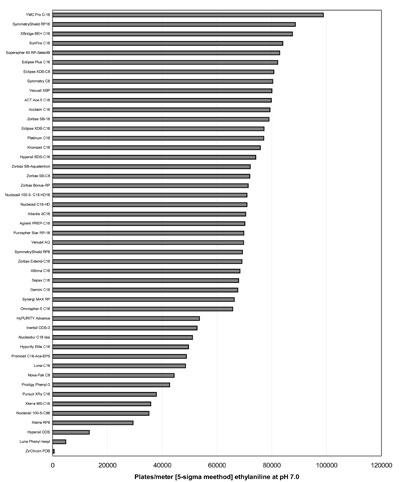
| sample | thiourea 2-hydroxy-4-methylpyridine phthalazine 3-aminoquinoline 4-ethylaniline | |
| eluent | Methanol/20 mM sodium formiate pH 3.0 = 20/80 (v/v) | |
| flow | 1 ml/min | |
| inj. volume: | 1 µl | |
| temperature: | 30 oC | |
| detection: | DAD 254 nm |
Test 5.1
In RPLC apart from hydrophobicity effects the retention and selectivity of polar and ionic analytes is also determined by additional secondary interaction mechanisms. Hence the retention of the basic test analyte (pKa-value = 5.0) is also determined by its rate of dissociation and also by the properties of the stationary phase substrate. Note that at the eluent pH of 3.0 in this test 4-ethylaniline will be protonated. The additional retention effects for 4-ethylaniline and similar analytes can be further illustrated by comparing the column rankings in this table and the tables 1.1, 2.1, 3.1 and 4.1.
Ranking according to the retention factor of 4-ethylaniline. pH=3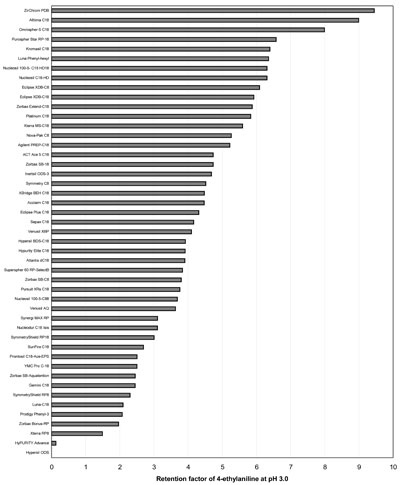
Test 5.2
Peak asymmetry can be caused by imperfection of the column bed, non-optimal thermodynamics, external column band broadening effects and sample overload of a column. Increasing peak asymmetry results in decreasing column efficiencies and peak capacity. The USP-tailing factor is a convenient measure to express the asymmetry of an analyte peak. Ideally this value should be close to one for symmetric peaks. Summarizing the actual plate number of a column and hence its peak capacity is also determined by the rate of asymmetry of the analyte peaks.
Ranking according to the USP-tailing factor of 4-ethylaniline. pH=3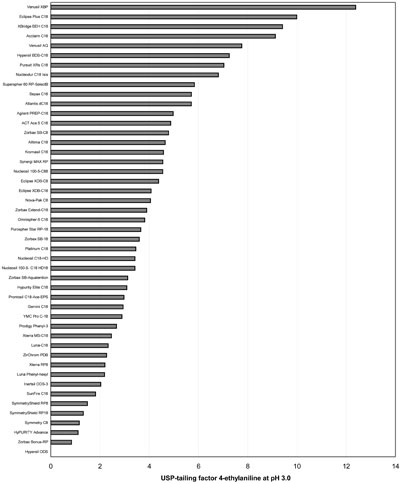
Test 5.3
Usually the efficiency (N) of a column is expressed as the number of plates per meter. In this test the N-values for 4-ethylanaline (pKa-value = 5.0) reflect the more complex thermodynamics for basic analytes on RPLC columns. Note that at the eluent pH of 3.0 in this test the low pKa analyte 4-ethylaniline will be deprotonated. The additional efficiency effects for 4-ethylaniline and similar low pKa basic analytes can be further illustrated by comparing this table with the tables 1.3, 2.3, 3.3 and 4.3.
Ranking according to the efficiency measured for 4-ethylaniline. pH=3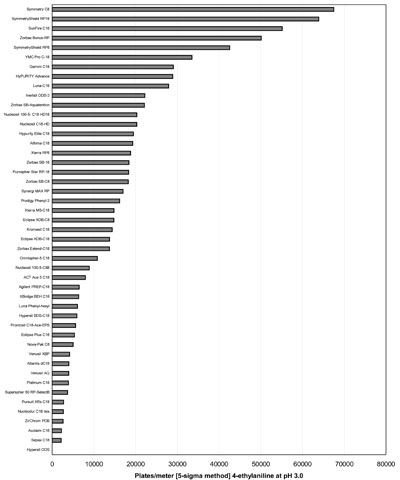
| sample | thiourea 4,4’-bipyridine 2,2’-bipyridine | |
| eluent | Methanol/Water = 50/50 (v/v) | |
| flow | 1 ml/min | |
| inj. volume: | 1 µl | |
| temperature: | 30 oC | |
| detection: | DAD 254 nm |
Test 6
Metal impurities incorporated in RPLC stationary phases may cause problems in chromatographic practice. Such metal impurities can originate from the manufacturing process of the stationary phase and/or by accumulation of traces of metals from the eluent and HPLC equipment.
On silica based RPLC phases metal impurities may increase the acidity of adjacent silanols. In turn this can cause poor peak shapes and irreversible interactions especially with basic analytes.
Furthermore, analytes with chelating properties can also interact with metal impurities resulting in poor peak shape and reduced analyte detectability. The ratio of the USP-tailing factors of 2,2’-bipyridyl towards 4,4’-bipyridyl has proven to be a reliable measure for the metal activity in RPLC columns (ref. 9).
Ranking according to metal activity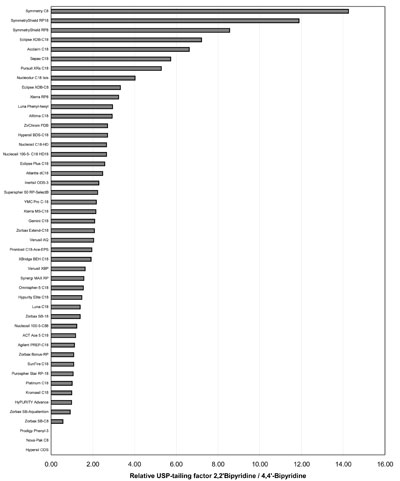
| sample | thiourea o-terphenyl triphenylene | |
| eluent | Methanol/Water = 80/20 (v/v) | |
| flow | 1 ml/min | |
| inj. volume: | 1 µl | |
| temperature: | 30 oC | |
| detection: | DAD 254 nm |
Test 7
Shape selectivity is an important property of RPLC phases. It mainly depends on the structure of the bonded ligands and also on the column temperature. Some members of organic substances for example polyaromatic hydrocarbons (PAH’s) may only differ in their spatial conformation. Therefore, a sufficient shape selectivity of RPLC phases is necessary for the separation of such analytes. The relative retention, α, of two PAH’s, triphenylene towards o-terphenyl has proven to be a reliable measure of the shape selectivity of RPLC phases (ref.11).
Ranking according to shape selectivity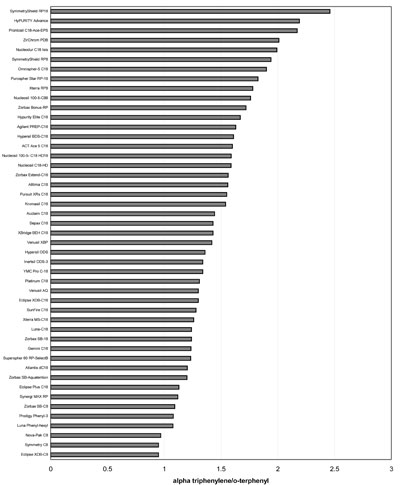
Silica based RPLC stationary phases, even if they are end capped, still contain unreacted silanol groups. The chemical modification process, the ligand surface coverage and the end capping determine the accessibility of these residual silanols by analytes. The hydrogen bonding capacity is a measure representing the residual silanol activity of a RPLC stationary phase. This magnitude is determined by measuring the relative retention factor of caffeine versus phenol (ref. 10).
| sample | thiourea phenol caffeine | |
| eluent | Methanol/Water = 30/70 (v/v) | |
| flow | 1 ml/min | |
| inj. volume: | 1 µl | |
| temperature: | 30 oC | |
| detection: | DAD 254 nm |
Ranking accoring to Tanaka Hydrogen Bonding Capacity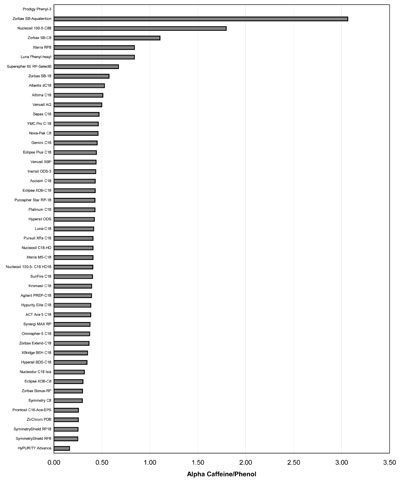
Conclusions / remarks
- RPLC columns may substantially differ in their chromatographic properties. This also depends on the nature of the analytes and the composition of the eluent. The same is also true for nominally identical RPLC phases.
- A substantial amount of information on the chromatographic and other properties of RPLC columns is available from technical and scientific sources including the internet.
- The selection of the proper column for a particular separation is a crucial step in method development. Apart from the chromatographic properties of a column, its chemical and thermal stability properties must be considered as well.
- Until now no simple tests exist to characterize the complex nature of RPLC columns. Additionally, many of the presently available tests produce non-corresponding characterization results.
- In this report approximately 50 RPLC columns have been tested following a number of in-house tests. In these tests neutral, acidic, and basic test analytes were used under different eluent pH conditions. The results reveal the complex nature of RPLC columns. These results can be helpful in the selection process of the best RPLC column for a particular separation.
References
1. H.A. Claessens, Trends in analytical chemistry, 20 (2001) 10, 563-583.
2. Colin F Poole, The Essence of Chromatography, Elsevier, Amsterdam, 2003, ISBN 0444501991.
3. E. Katz, R. Eksteen , P. Schoenmakers and N. Miller ( Eds.), Handbook of HPLC, Chromatographic Science Series , vol. 78, Marcel Dekker Inc., New York, 1998.
4. U.D. Neue, HPLC Columns: Theory, Technology and Practice, Wiley-VCH, New York, 1997, ISBN 0-471-19037-3.
5. L.R. Snyder, J.J. Kirkland, J.L. Glajch, Practical HPLC Development, 2nd Ed., Wiley, New York, 1998, ISBN 0-8247-9444-3.
6. U.D. Neue, B.A. Alden, T.H. Walter, J. Chromatography. A, 849 (1999) 101.
7. H.A. Claessens, M.A. van Straten, J. Chromatogr. A, 1060 (2004) 23-41.
8. H.A. Claessens, M.A. van Straten, C.A. Cramers, M. Jezierka, B. Buszewski, J. Chromatogr. A, 826 (1998) 135.
9. H. Engelhardt and T. Lobert, Anal. Chem., 71 (1999) 1885-1892.
10. K. Kimata, K. Iwaguchi, S. Onishi, K. Jinno, R. Eksteen, K. Hosoya, M. Araki and N. Tanaka, J. Chrom. Science, vol 27, Dec 1989, 721-728.
11. H. Engelhardt, M. Nikolov, M. Arangio, M. Scherer, Chromatographia, 48, 3-4, Augustus 1998, 183-189.